Fundamental
Prepare and test your skills

Fundamental
Prepare and test your skills
Managed Collection Automates Prometheus on GKE
Free sample question with answers and detailed explanation below. The Associate Cloud Engineer practice bank has an additional 2,014 practice questions.Try 10 free realistic questions: instant score, no credit card, and no account required.
Your operations team is deploying applications to several Google Kubernetes Engine (GKE) clusters and needs to collect Prometheus metrics. The team wants a solution that minimizes administrative overhead by eliminating the need to manually scale, shard, or maintain Prometheus servers. Additionally, they require a fully supported Google Cloud experience that configures scraping through lightweight Kubernetes custom resources.
Which collection mode should you choose for Google Cloud Managed Service for Prometheus?
Explanations
Ops Agent collection
Ops Agent collection
What Ops Agent Collection Is
The Google Cloud Ops Agent is the primary telemetry collection agent installed directly on virtual machine operating systems within Compute Engine. It combines metric and log collection into a unified daemon and features built-in support to discover and scrape Prometheus exporters hosted on individual virtual machines.
Why It Doesn't Meet the Requirements
- Designed for VM workloads, not GKE clusters: The Ops Agent is built to run on Compute Engine virtual machine guest operating systems, not as an in-cluster collection framework for Kubernetes Pods and Services.
- Lacks Kubernetes CRD integration: It does not use Kubernetes Custom Resource Definitions like
PodMonitoringorClusterPodMonitoringto discover dynamic container endpoints. - Misaligned operational model: While it simplifies VM metric scraping, deploying individual host-level agents does not address Kubernetes-native service discovery, Pod lifecycles, or containerized scrape targets.
Key Characteristics and Limitations
- Host-level telemetry: Designed specifically for operating system metrics, application logs, and third-party integrations on Compute Engine VMs.
- Simplified VM discovery: Eliminates the overhead of deploying and configuring Prometheus servers in standalone virtual machine environments.
- Single daemon deployment: Combines Fluent Bit for logging and an OpenTelemetry-based collector for host metrics into a single system service.
- Not applicable to container-native architectures: Cannot dynamically track ephemeral container endpoints across a GKE cluster.
This Answer Would Be Correct If
This option would be correct if the scenario involved monitoring legacy enterprise applications running on standalone Compute Engine virtual machines that expose Prometheus metrics endpoints, rather than containerized microservices hosted on GKE.
Additional Context
Although the Ops Agent is the recommended solution for Compute Engine virtual machine monitoring, GKE environments have dedicated native collection mechanisms that integrate directly into Kubernetes API machinery.
Managed collection
Managed collection
What Managed Collection Is
Google Cloud Managed Service for Prometheus (GMP) offers managed collection as Google's recommended approach for Kubernetes environments, including Google Kubernetes Engine (GKE). In this mode, an in-cluster Kubernetes operator (gmp-operator) deploys and oversees collection infrastructure automatically, drastically reducing the day-to-day operational burden of monitoring containerized environments.
How It Meets the Requirements
- Eliminates administrative overhead: The Kubernetes operator fully automates administrative operations—such as generating scrape configurations, scaling collection capacity, and sharding ingestion targets across nodes—so administrators do not need to manage Prometheus server fleets manually.
- Configured via custom resources: Scraping endpoints and evaluation rules are defined declaratively through lightweight Kubernetes Custom Resource Definitions (CRDs), such as
PodMonitoringandClusterPodMonitoring. - Full platform support: Managed collection is natively integrated into GKE (enabled by default in modern GKE Autopilot and Standard versions) and receives full technical support assistance from Google Cloud.
Managed Collection Scrape Automation Flow
Process Flow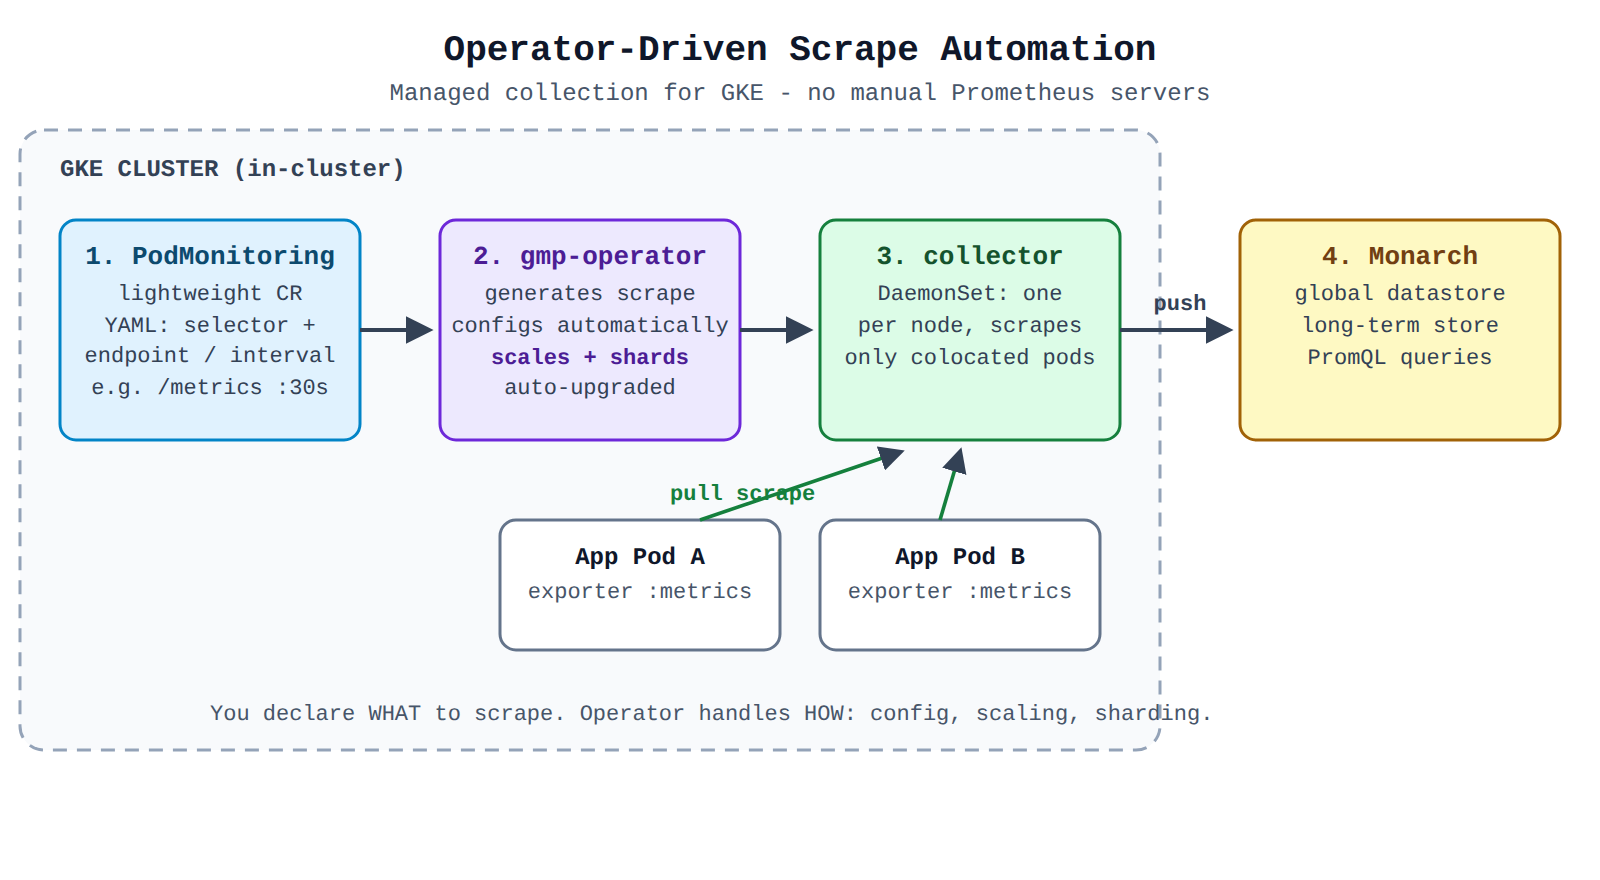
Key Advantages and Capabilities
- Automated scaling and sharding: Ingestion workloads are scaled horizontally across cluster nodes using a daemonset-based collector architecture without manual tuning.
- Declarative Kubernetes native management: Development teams manage telemetry configurations alongside application manifests using familiar Kubernetes YAML declarations.
- Automatic upgrades: On GKE, the in-cluster monitoring components are automatically maintained and upgraded when new versions are released.
- Centralized global datastore: Scraped metrics are sent directly to Google Cloud's globally distributed Monarch backend, eliminating local disk management for long-term time-series storage.
- Seamless transition: Supports intuitive migration pathways from existing upstream
prometheus-operatorconfigurations.
Why This Is Optimal
For Kubernetes workloads on GKE, managed collection provides the ideal balance between native Prometheus compatibility and cloud-managed simplicity. Unlike self-deployed alternatives that require manual capacity planning and infrastructure maintenance, managed collection automates operational toil while retaining complete support from Google Cloud engineers.
Self-deployed collection
Self-deployed collection
What Self-Deployed Collection Is
Self-deployed collection allows organizations to retain full ownership over their Prometheus deployment while using a drop-in binary replacement provided by Google Cloud Managed Service for Prometheus. Instead of upstream Prometheus writing to local disk, the custom binary streams scraped data to Google Cloud's managed backend while preserving traditional Prometheus configurations.
Why It Doesn't Meet the Requirements
- High operational overhead: Self-deployed collection requires operations teams to manually plan, configure, and maintain Prometheus server instances.
- Manual scaling and sharding: If metric volumes grow or cluster size expands, functional sharding and capacity scaling must be managed manually by cluster operators.
- No automated operator management: It does not leverage Google's managed operator for automated lifecycle management, and scraping is handled via custom configurations or legacy mechanisms rather than streamlined managed Custom Resources.
- Limited support: Deployments using self-deployed collection receive limited technical assistance from Google Cloud support compared to the fully supported managed mode.
Key Characteristics and Limitations
- Manual server management: Administrators are responsible for resource allocation, scaling, high availability, and version upgrades of the Prometheus server.
- Drop-in binary replacement: Retains existing upstream configuration syntax and deployment tools (such as community Helm charts or the Prometheus Operator).
- Edge-friendly rule evaluation: Rules and alerts can evaluate locally within individual Prometheus servers, avoiding unnecessary network traffic.
- Specialized use case support: Accommodates edge architectures or non-standard requirements, such as custom local data aggregations to reduce metric cardinality prior to export.
This Answer Would Be Correct If
This approach would be the right choice if your organization had a complex, legacy Prometheus installation that heavily relies on existing upstream configurations or requires specialized capabilities like local metric aggregation to control cardinality before sending metrics to Google Cloud.
Additional Context
While self-deployed collection is valuable for gradual migrations or specialized setups running alongside upstream Prometheus, it re-introduces the maintenance complexity that fully managed GKE collection was designed to eliminate.
OpenTelemetry Collector
OpenTelemetry Collector
What the OpenTelemetry Collector Is
The OpenTelemetry Collector is a vendor-agnostic, open-source proxy agent capable of receiving, processing, and exporting telemetry data across multiple signals, including metrics, logs, and distributed traces. When integrated with Google Cloud Managed Service for Prometheus, it can scrape Prometheus endpoints using a Prometheus receiver and forward metrics to Cloud Monitoring.
Why It Doesn't Meet the Requirements
- Higher deployment and maintenance overhead: The operations team must independently design, configure, deploy, and scale the OpenTelemetry Collector pipelines rather than relying on an automated, turnkey Kubernetes operator.
- Configuration divergence: Scraping is configured via the OpenTelemetry collector's custom YAML configuration syntax (using its Prometheus receiver) rather than Google Cloud's simplified, native
PodMonitoringcustom resources. - Not the primary recommended GKE solution: While supported, Google Cloud explicitly recommends managed collection over the OpenTelemetry Collector for general Kubernetes workloads because managed collection minimizes operational complexity.
Key Characteristics and Limitations
- Multi-signal support: Unifies metric collection, application logging, and distributed tracing into a single agent architecture.
- Cross-environment flexibility: Can run across multiple clouds, on-premises data centers, or serverless environments like Cloud Run.
- Extensible data pipelines: Supports sophisticated processors for metric manipulation, attribute enrichment, and resource detection.
- Custom operational responsibility: Requires users to configure and maintain ingestion pipelines, scaling parameters, and deployment models manually.
This Answer Would Be Correct If
The OpenTelemetry Collector would be the appropriate choice if your organization implemented a unified single-agent observability strategy requiring the simultaneous capture of distributed traces, application logs, and Prometheus metrics across hybrid cloud or multi-cloud environments.
Additional Context
While the OpenTelemetry Collector provides great power for cross-signal correlation and multi-cloud tracing, choosing it solely for standard Prometheus metric collection on GKE introduces unnecessary configuration overhead compared to managed collection.
Try 10 interactive questions like this one, free
Answer them yourself and get your score the moment you finish. No account needed.
Full access includes
- 2,014 practice questions across all 4 exam domains
- Every answer explained: why it is right, and why the others are not
- Scout, an AI tutor that answers your follow-up questions
- Readiness tracking by domain, so you know when to book the exam
Related free sample questions
Keep the momentum going with these hand-picked practice scenarios
FundamentalAssociate Cloud Engineer
ClusterPodMonitoring vs PodMonitoring
Deploying Google Cloud Managed Service for Prometheus
FundamentalAssociate Cloud Engineer
Cloud Monitoring Metrics Explorer PromQL
Deploying Google Cloud Managed Service for Prometheus
FundamentalAssociate Cloud Engineer
Cloud NAT with Cloud DNS Private Zones
Working with Cloud DNS and Cloud NAT
FundamentalAssociate Cloud Engineer
Trace and SpanId Log Correlation
Viewing specific log message details in Cloud Logging
FundamentalAssociate Cloud Engineer
Auto Mode VPC 10.128.0.0/9 Reserved Range
Adding a subnet to an existing VPC
IntermediateProfessional Cloud Developer
ADC with Service Account Impersonation
Managing connections to various Google Cloud datastores (e.g., Cloud SQL, Firestore, Cloud Storage)
Last updated