Fundamental
Prepare and test your skills

Fundamental
Prepare and test your skills
Checking Prometheus Targets with PromQL
Free sample question with answers and detailed explanation below. The Associate Cloud Engineer practice bank has an additional 2,014 practice questions.Try 10 free realistic questions: instant score, no credit card, and no account required.
Your operations team has deployed Google Cloud Managed Service for Prometheus using managed collection on a Google Kubernetes Engine (GKE) cluster. You need to confirm that application targets are healthy and actively sending metrics by evaluating the standard up metric using Prometheus Query Language (PromQL). In addition, you want to view the resulting time-series chart directly within the Google Cloud console and add it to a custom dashboard.
What should you do?
Explanations
In Cloud Shell, establish a kubectl port-forward session to the Prometheus server pod on port 9090, and access the local Expression Browser.
In Cloud Shell, establish a kubectl port-forward session to the Prometheus server pod on port 9090, and access the local Expression Browser.
What the Prometheus Expression Browser and kubectl port-forward Does
In traditional self-managed Prometheus architectures, the Prometheus server hosts a built-in web interface called the Expression Browser. Operators commonly use kubectl port-forward to map a local workstation port to port 9090 of the Prometheus pod, enabling access to a simple web GUI for ad-hoc debugging and graphing.
Why It Doesn't Meet the Requirement
- Does not run in the Google Cloud console: Port-forwarding opens a browser session on
localhostoutside of the Google Cloud console. - Cannot create Cloud Monitoring dashboards: The local Prometheus web interface has no native mechanism to publish, export, or sync its UI charts into persistent Cloud Monitoring dashboards.
- Unnecessary operational overhead: Running a dedicated open-source Prometheus server alongside Managed Service for Prometheus introduces duplicate resource consumption and manual maintenance, which defeats the purpose of adopting a fully managed Prometheus service.
Key Characteristics and Limitations
- The built-in Expression Browser is designed only for temporary, ad-hoc metric debugging.
- Lacks enterprise dashboarding capabilities such as role-based access control, persistent multi-user layouts, and multi-project scoping.
- Relies on local pod storage instead of querying the scalable, long-term Monarch repository.
- Does not integrate with Google Cloud IAM or Cloud Monitoring dashboard APIs.
This Answer Would Be Correct If
This approach would be suitable in an unmanaged, on-premises Kubernetes environment where external cloud services are unavailable and an engineer requires a temporary debugging session directly against a standalone Prometheus instance.
Additional Context
To use dedicated third-party dashboards with Managed Service for Prometheus, organizations typically connect Grafana using the Cloud Monitoring data source plugin or query frontend proxy, rather than relying on ephemeral local Expression Browsers.
In Cloud Logging, navigate to Logs Explorer, change the query filter language to PromQL, enter up, and run the search.
In Cloud Logging, navigate to Logs Explorer, change the query filter language to PromQL, enter up, and run the search.
What Cloud Logging Logs Explorer Is
Cloud Logging Logs Explorer is a dedicated analysis interface in the Google Cloud console designed to search, filter, and inspect structured and unstructured log records. It operates using the Logging query language, which is optimized for querying text payloads, log fields, timestamps, and resource labels across collected log streams.
Why It Doesn't Meet the Requirement
- Wrong telemetry signal: The requirement is to evaluate numeric time-series metrics collected by Managed Service for Prometheus, whereas Logs Explorer processes log entries.
- Incompatible query language: Logs Explorer does not support PromQL. Attempting to enter PromQL expressions like
upinto Logs Explorer will result in syntax errors. - No direct metric charting: While Cloud Logging can create log-based metrics, the raw data collected from Prometheus scrapers is stored directly as time-series metrics in the Monarch backend, accessible via Cloud Monitoring, not within the log storage buckets queried by Logs Explorer.
Key Characteristics and Limitations
- Designed strictly for log analytics, text parsing, and log entry filtering.
- Uses Logging query language syntax (e.g.,
resource.type="k8s_container"ANDtextPayload =~ "error"). - Does not connect to the Monarch metric datastore or parse Prometheus gauge/counter formats.
- Cannot natively render time-series line graphs from raw Prometheus exporter data.
This Answer Would Be Correct If
This approach would be appropriate if you needed to search for stdout/stderr application error traces, debug container startup failures via Kubernetes container logs, or extract custom counter metrics from text logs using Log-based Metrics.
Additional Context
A common point of confusion is mixing the separate pillars of observability—metrics and logs. In Google Cloud Observability, metric analysis belongs in Cloud Monitoring (Metrics Explorer), while log record inspection belongs in Cloud Logging (Logs Explorer).
In Cloud Monitoring, navigate to Metrics Explorer, switch the query editor mode to PromQL, enter up, and execute the query.
In Cloud Monitoring, navigate to Metrics Explorer, switch the query editor mode to PromQL, enter up, and execute the query.
What Cloud Monitoring Metrics Explorer and PromQL Integration Is
Google Cloud Managed Service for Prometheus automatically ingests metric data into Google's globally distributed time-series datastore, Monarch. Because it shares the backend storage architecture with Cloud Monitoring, Google provides native support for Prometheus Query Language (PromQL) directly inside the Google Cloud console. Within Cloud Monitoring, tools such as Metrics Explorer and dashboard chart builders allow engineers to query and visualize ingested Prometheus time series without needing to deploy or maintain self-hosted query engines.
How It Meets the Requirements
- Query Prometheus metrics in Google Cloud console: Navigating to Metrics Explorer and selecting the PromQL mode switch in the query builder toolbar allows you to input raw PromQL expressions directly.
- Verify data ingestion: Running the standard
upquery immediately scans Monarch to return the health status of scraped targets. If targets are successfully reporting, the query evaluates to1, generating an instant visual time-series chart. - Integrate into Cloud Monitoring dashboards: Any query constructed in Metrics Explorer can be saved directly to a custom dashboard using the Save to Dashboard option, or entered directly into the Code tab when adding a new chart to a Cloud Monitoring dashboard.
Metrics Explorer PromQL Workflow
Process Flow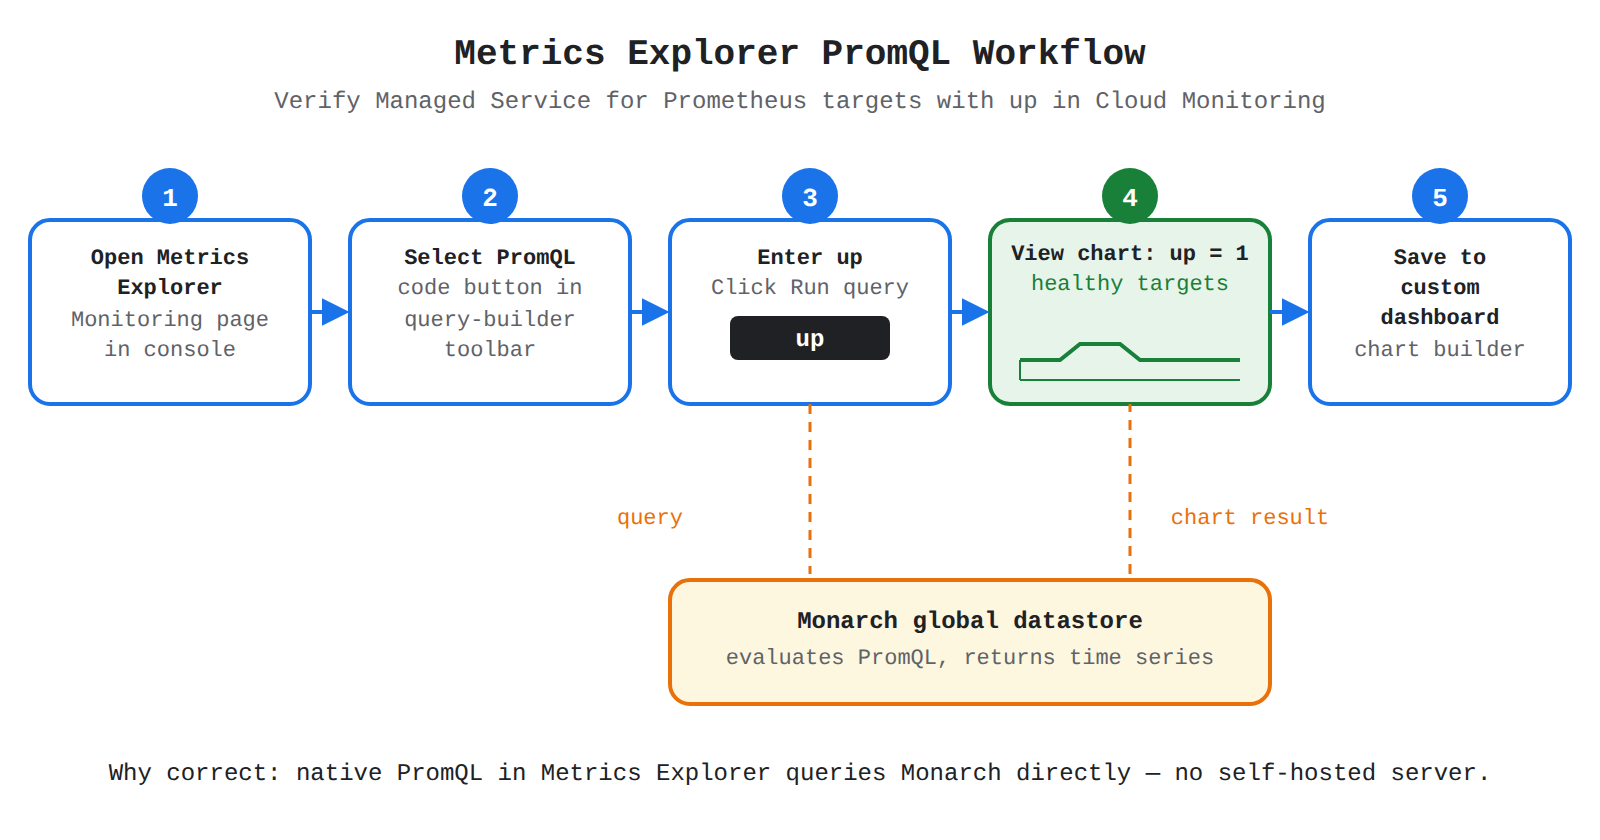
Key Advantages and Capabilities
- Familiar PromQL syntax: Allows teams to reuse existing open-source queries, metric selectors, and PromQL functions without rewriting them into Monitoring Query Language (MQL).
- Global querying at scale: Queries evaluate against Monarch rather than querying ephemeral local cluster storage, providing multi-cluster and cross-project visibility across up to 3,500 projects.
- Immediate validation: Offers instantaneous visual confirmation whether the managed collection operator is scraping exporters properly.
- Native alerting integration: PromQL queries created in Metrics Explorer can easily be converted into Cloud Monitoring alerting policies.
- Unified observability: Combines Prometheus application telemetry with native Google Cloud system metrics on the same console canvas.
Why This Is Optimal
Using Cloud Monitoring Metrics Explorer with the PromQL editor provides a serverless, out-of-the-box observability experience. It eliminates the overhead of managing local query infrastructure, simplifies verification of newly deployed workloads, and seamlessly integrates metric visualizations into persistent Cloud Monitoring dashboards.
In the GKE console, connect to the collector pod terminal, execute promtool query instant up, and export the text stream to Cloud Monitoring.
In the GKE console, connect to the collector pod terminal, execute promtool query instant up, and export the text stream to Cloud Monitoring.
What promtool and Pod Terminal Execution Does
promtool is an open-source command-line utility bundled with standard Prometheus installations. It is primarily used for offline linting of configuration files, validating Prometheus alerting rules, and performing ad-hoc instant queries against a locally running Prometheus HTTP server. Accessing a pod terminal involves using kubectl exec to enter a running container on a Google Kubernetes Engine (GKE) cluster.
Why It Doesn't Meet the Requirement
- Fails the console visualization requirement: Executing command-line utilities within a container terminal outputs text-based terminal strings, not graphical dashboards or console charts.
- No integration with Cloud Monitoring dashboards:
promtooldoes not communicate with Cloud Monitoring APIs to generate dashboard widgets, store visualizations, or link to persistent charts. - Architecture misalignment with Managed Service for Prometheus: Under managed collection, Prometheus servers do not store historical time series on local disks; instead, collector agents scrape targets and immediately ship them to the global Monarch datastore.
promtoolrunning locally inside a pod cannot query global Monarch storage.
Key Characteristics and Limitations
- Designed for local command-line validation and rule unit testing.
- Requires Kubernetes RBAC permissions to access cluster pods (
pods/exec). - Produces text or JSON formatted console stdout rather than time-series graphs.
- Operates strictly locally within the cluster network boundary without interacting with Google Cloud console dashboard tools.
This Answer Would Be Correct If
This approach would be correct if a developer needed to perform automated CI/CD linting on Prometheus alerting rule YAML files or test rule syntax prior to committing changes to a Git repository.
Additional Context
In Google Cloud Managed Service for Prometheus, the query plane is centralized in the cloud backend. Querying individual cluster pods ignores the managed architecture that separates local scraping from global query evaluation.
Try 10 interactive questions like this one, free
Answer them yourself and get your score the moment you finish. No account needed.
Full access includes
- 2,014 practice questions across all 4 exam domains
- Every answer explained: why it is right, and why the others are not
- Scout, an AI tutor that answers your follow-up questions
- Readiness tracking by domain, so you know when to book the exam
Related free sample questions
Keep the momentum going with these hand-picked practice scenarios
FundamentalAssociate Cloud Engineer
ClusterPodMonitoring vs PodMonitoring
Deploying Google Cloud Managed Service for Prometheus
FundamentalAssociate Cloud Engineer
Managed Collection vs Self-Deployed Collection
Deploying Google Cloud Managed Service for Prometheus
FundamentalAssociate Cloud Engineer
_Required vs _Default Log Buckets
Configuring log buckets, log analytics, and log routers
FundamentalAssociate Cloud Engineer
Eventarc Pub/Sub Trigger for Cloud Run
Deploying an application to serverless compute platforms, including for the processing of Google Cloud events (e.g., Pub/Sub events, Cloud Storage object change notification events, Eventarc)
FundamentalAssociate Cloud Engineer
VPC Longest Prefix Match vs Priority
Adding custom static routes in a VPC
IntermediateProfessional Cloud Database Engineer
Persistent Disk Type Selection
Evaluate performance and cost tradeoffs of different database configurations (e.g., machine types, storage types)
Last updated