Fundamental
Prepare and test your skills

Fundamental
Prepare and test your skills
Correlating Cloud Logging Entries With Trace Spans
Free sample question with answers and detailed explanation below. The Associate Cloud Engineer practice bank has an additional 2,014 practice questions.Try 10 free realistic questions: instant score, no credit card, and no account required.
A cloud engineer is investigating an intermittent HTTP 500 error occurring across a distributed, multi-service application hosted on Google Cloud. When inspecting a failed request's log entry in Cloud Logging, the engineer needs to reconstruct the complete sequence of upstream and downstream service calls to determine which sub-operation caused the failure.
Which contextual fields in the log entry should the engineer evaluate to correlate the log with distributed tracing and view the event sequence?
Explanations
The resource.type and resource.labels fields
The resource.type and resource.labels fields
What resource.type and resource.labels are
In Google Cloud Logging, resource.type and resource.labels define the Monitored Resource that produced the log message. The resource.type string indicates the Google Cloud resource category (such as gce_instance, k8s_container, or cloud_run_revision), while resource.labels contains key-value pairs specifying the instance or service attributes (such as project_id, zone, cluster_name, or service_name).
Why they don't meet the requirement
- Missing transaction identification: Monitored resource attributes define where the code is hosted, not the request or transaction executing within that infrastructure.
- Shared across unrelated traffic: A single container or virtual machine handles thousands of concurrent requests. Filtering solely by resource labels returns logs from all interleaved requests rather than isolating the failed user flow.
- No caller-callee linking: Infrastructure labels do not cross network boundaries or track RPC calls made from one microservice to another.
Key characteristics and limitations
- Infrastructure scoping: Allows engineers to limit log queries to specific deployment environments, clusters, or zones.
- Static host attributes: Values reflect infrastructure topology rather than dynamic application state.
- No parent-child nesting: Cannot represent call hierarchies between frontend services, API gateways, and backend databases.
This answer would be correct if
This option would be correct if the engineer needed to isolate all log output generated by a specific Kubernetes pod or evaluate whether a physical host failure caused an application disruption.
Additional context
Resource attributes provide essential operational context regarding where a service is running, but they must be paired with distributed trace metadata (trace and spanId) to reconstruct the chronological journey of an individual user request across microservices.
The severity and receiveTimestamp fields
The severity and receiveTimestamp fields
What severity and receiveTimestamp are
The severity and receiveTimestamp fields capture operational importance and ingestion timing in Cloud Logging. severity indicates the criticality level of the log entry (such as INFO, WARNING, ERROR, or CRITICAL). receiveTimestamp denotes the precise UTC time when the Cloud Logging ingestion pipeline received and committed the log entry, distinct from the event's original generation timestamp.
Why they don't meet the requirement
- Clock correlation is non-causal: Relying strictly on timestamps fails in distributed systems due to clock drift, asynchronous network routing, and high concurrency. Chronologically sorted logs interleave events from hundreds of simultaneous transactions.
- Severity indicates symptoms, not flows: An
ERRORseverity identifies that a failure occurred, but it provides no context regarding which upstream request triggered the operation or which intermediate service failed first. - Lacks relational mapping: Neither field provides a unique transaction identifier that can link disparate logs across multiple services into a coherent sequence.
Key characteristics and limitations
- Chronological ordering only: Provides linear ordering within a single log stream, but cannot establish transaction boundaries across distributed systems.
- Alerting mechanism:
severityis primarily intended for metric-based alerts and alerting policies. - Latency auditing:
receiveTimestamphelps identify ingestion lag between log emission and storage.
This answer would be correct if
This option would be correct if the engineer needed to find all high-priority errors that occurred during a specific deployment window or calculate ingestion latency for logs delivered to Cloud Logging.
Additional context
Effective root-cause investigations move beyond chronological processing. High transaction volumes produce significant noise when searching solely by timestamp and severity, making distributed trace correlation necessary for pinpointing failures.
The insertId and logName fields
The insertId and logName fields
What insertId and logName are
The insertId and logName fields represent low-level ingestion metadata in a Cloud Logging LogEntry structure. The insertId is a unique system-generated or user-supplied string assigned to an individual log record to enforce idempotency and assist with log deduplication during ingestion. The logName property defines the resource URI identifying the specific log stream or container, such as projects/[PROJECT_ID]/logs/stderr or projects/[PROJECT_ID]/logs/cloudaudit.googleapis.com%2Factivity.
Why they don't meet the requirement
- No correlation across services: The
insertIduniquely identifies a single log record and carries no semantic or contextual relationship to prior or subsequent operations executed by other microservices. - Lacks request context: The
logNameonly indicates which log stream received the message. It does not carry transaction-specific or request-level identifiers. - Cannot build call sequences: Neither field provides hierarchical or causal information, making it impossible to determine caller-callee relationships or trace an HTTP request through a multi-tier architecture.
Key characteristics and limitations
- Deduplication mechanism:
insertIdensures that retried log writes do not produce duplicate entries in storage. - Stream classification:
logNamehelps organize logs into streams for filtering, sink routing, and Identity and Access Management (IAM) permissions. - Isolated record scope: Describes how an isolated record was received rather than how the application executed its business logic.
This answer would be correct if
This answer would be correct if the engineer needed to filter logs originating from a specific logging stream (such as stdout vs. audit logs) or prevent duplicate log entries when implementing a custom logging client that retries network requests.
Additional context
While insertId is valuable for log streaming pagination and verifying that an individual message reached Cloud Logging, it cannot connect independent log entries across microservices into a unified transaction timeline.
The trace and spanId fields
The trace and spanId fields
What trace and span identifiers are
In Google Cloud Logging and distributed tracing architectures, the trace and spanId fields supply contextual execution metadata that links log records directly to distributed traces in Cloud Trace. The trace field contains a resource string identifying the overall end-to-end transaction (formatted as projects/[PROJECT_ID]/traces/[TRACE_ID]), while the spanId field identifies the specific sub-operation or unit of execution within that broader trace. These identifiers adhere to industry standards like W3C Trace Context, allowing Google Cloud to track an incoming user request as it traverses multiple decoupled microservices.
How they meet the investigation requirements
- Reconstructing event sequences: When multiple services log events during a single transaction, each service attaches the shared
traceidentifier to its log records. By querying for that specific trace ID, an engineer can retrieve every log message emitted across all participating services for that exact request lifecycle. - Pinpointing sub-operation failures: The
spanIdisolates the specific remote procedure call (RPC) or internal routine that failed. Within the Cloud Logging console, selecting the trace context allows engineers to pivot directly to the trace waterfall view, revealing the nested parent-child hierarchy and highlighting which downstream service threw the HTTP 500 error. - Trace-to-log correlation: Cloud Logging natively correlates logs and traces. When viewing trace spans, engineers can view corresponding log messages written during that span's execution window without manually cross-referencing timestamps.
Trace Waterfall: Finding the Failed Span
Timeline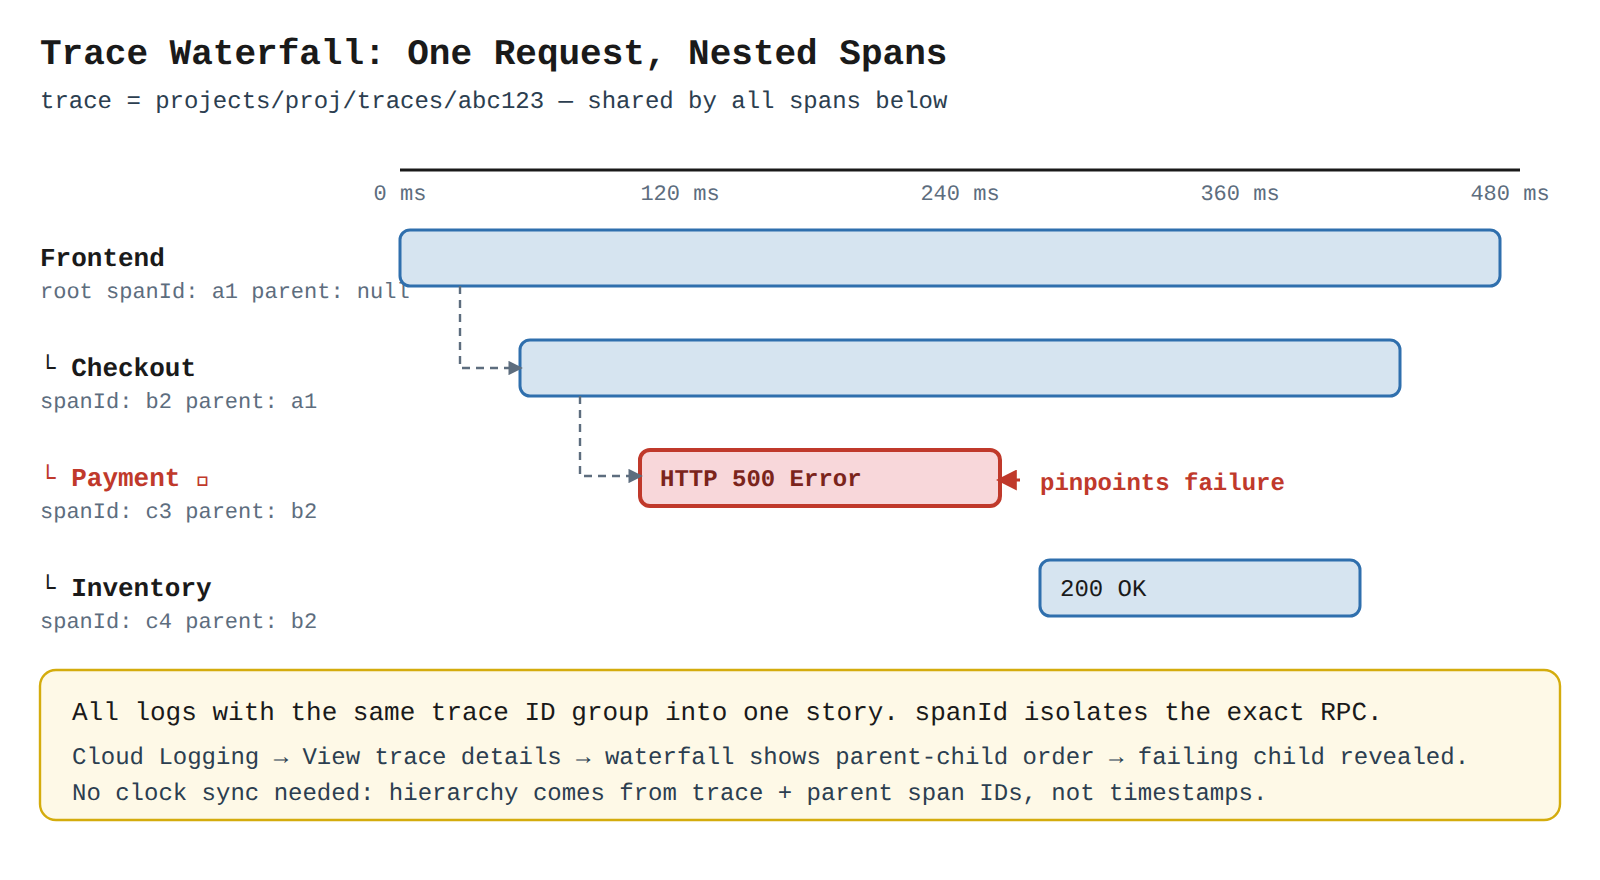
Key advantages and capabilities
- End-to-end observability: Unifies disparate logs across Compute Engine, Google Kubernetes Engine (GKE), and Cloud Run into a continuous transaction narrative.
- Parent-child hierarchy: Clearly outlines service call order and nested dependencies through parent-child span associations.
- Accelerated root-cause analysis: Enables one-click navigation between log entries in Cloud Logging and latency timelines in Cloud Trace.
- Standardized propagation: Uses established distributed tracing conventions (such as the W3C
traceparentspecification) supported by OpenTelemetry. - Accurate causal ordering: Eliminates dependency on clock synchronization across multiple asynchronous microservices.
Why this is optimal
Relying on trace and spanId is the standard, best-practice approach in Google Cloud for troubleshooting distributed transactions. While resource labels and timestamps indicate where and when a log was emitted, only distributed trace identifiers establish true causal relationships and parent-child execution structure across distributed cloud infrastructure.
Try 10 interactive questions like this one, free
Answer them yourself and get your score the moment you finish. No account needed.
Full access includes
- 2,014 practice questions across all 4 exam domains
- Every answer explained: why it is right, and why the others are not
- Scout, an AI tutor that answers your follow-up questions
- Readiness tracking by domain, so you know when to book the exam
Related free sample questions
Keep the momentum going with these hand-picked practice scenarios
FundamentalAssociate Cloud Engineer
LogEntry MonitoredResource Field
Viewing specific log message details in Cloud Logging
FundamentalAssociate Cloud Engineer
Predefined vs Basic IAM Roles
Managing IAM permissions of a service account
FundamentalAssociate Cloud Engineer
Compute Engine Instance Templates
Creating an autoscaled managed instance group by using an instance template
FundamentalAssociate Cloud Engineer
Cloud DNS Managed Private Zones
Working with Cloud DNS and Cloud NAT
FundamentalAssociate Cloud Engineer
gcloud compute instances list --filter
Viewing current running Compute Engine instances
FundamentalGenerative AI Leader
Chain-of-Thought Prompting
Identifying advanced prompting techniques and when to use them (e.g., chain-of-thought prompting, ReAct prompting)
Last updated