Fundamental
Prepare and test your skills

Fundamental
Prepare and test your skills
Cluster-Wide Prometheus Scraping With ClusterPodMonitoring
Free sample question with answers and detailed explanation below. The Associate Cloud Engineer practice bank has an additional 2,014 practice questions.Try 10 free realistic questions: instant score, no credit card, and no account required.
You have a Google Kubernetes Engine (GKE) cluster with Google Cloud Managed Service for Prometheus managed collection enabled. You are deploying a cluster-wide service mesh and need to collect metrics from proxy pods that share the label app.kubernetes.io/name: proxy-agent. These pods run across multiple distinct Kubernetes namespaces.
You need to define metric scraping for these pods using a single custom resource without deploying duplicate manifests into every namespace.
Which custom resource should you implement?
Explanations
PodMonitoring
PodMonitoring
What PodMonitoring is
PodMonitoring is a namespaced Kubernetes custom resource in Google Cloud Managed Service for Prometheus designed to configure metric scraping for pods running within a single, specific namespace.
Why it doesn't meet the requirement
- Strictly scoped to one namespace: A
PodMonitoringresource can only discover and scrape pods located in the namespace where the resource itself is deployed. It cannot cross namespace boundaries. - Requires duplicated manifests: To scrape the proxy agents across multiple namespaces using
PodMonitoring, administrators would need to deploy and manage a separatePodMonitoringmanifest in every individual namespace, violating the requirement to use a single custom resource.
Key characteristics and limitations
- Namespace isolation: Ideal for decentralized, multi-tenant setups where individual development teams manage their own monitoring configurations within their assigned namespaces.
- Local label selection: Matches pods using
spec.selector.matchLabelsexclusively within its local namespace. - Per-namespace lifecycle: Deleting or modifying a
PodMonitoringobject only affects metric collection within that particular namespace.
This answer would be correct if
This resource would be the right choice if your application pods were confined to a single dedicated namespace, or if tenant teams required self-service monitoring configurations isolated from other teams.
Additional context
You can inspect all deployed PodMonitoring resources across the cluster using kubectl get podmonitoring -A, but each entry in that list operates only within its defined namespace.
MonitoringTarget
MonitoringTarget
What MonitoringTarget is
MonitoringTarget is a custom resource used exclusively in Google Distributed Cloud (GDC) air-gapped environments to define workload scraping endpoints and collection frequencies for local monitoring systems.
Why it doesn't meet the requirement
- Different platform API:
MonitoringTargetbelongs to themonitoring.gdc.goog/v1API group designed for Google Distributed Cloud hosted environments, not Google Cloud Managed Service for Prometheus on GKE (monitoring.googleapis.com/v1). - Project and namespace bound: In Google Distributed Cloud,
MonitoringTargetis deployed into specific project namespaces in the Management API server to collect metrics from workloads within that specific boundary.
Key characteristics and limitations
- Air-gapped architecture: Built to scrape workloads and visualize metrics within an internal, disconnected Grafana deployment rather than Google Cloud Monitoring.
- Annotation or static endpoints: Supports configuring endpoints using pod annotations (
prometheus.io/port,prometheus.io/path) or static endpoint definitions inside the custom resource. - Incompatible with standard GKE: The standard GKE managed Prometheus operator does not recognize or reconcile the
MonitoringTargetcustom resource definition.
This answer would be correct if
You were configuring metrics collection for workloads deployed inside an air-gapped Google Distributed Cloud environment using the Management API server.
Additional context
When working with public Google Cloud and GKE, metric scraping target definitions are always configured using PodMonitoring or ClusterPodMonitoring.
ClusterPodMonitoring
ClusterPodMonitoring
What ClusterPodMonitoring is
ClusterPodMonitoring is a non-namespaced Kubernetes custom resource provided by Google Cloud Managed Service for Prometheus. It allows cluster operators to configure Prometheus scrape jobs that automatically discover and scrape metrics from pods matching specified label selectors across the entire cluster, spanning all existing and future namespaces.
How it meets the requirements
- Cross-namespace target discovery: Unlike namespace-scoped scraping mechanisms,
ClusterPodMonitoringdoes not restrict its discovery process to a single namespace. It scans across all namespaces to locate any pod labeledapp.kubernetes.io/name: proxy-agent. - Single manifest deployment: Because it is a cluster-level resource, you only need to apply one manifest. This completely eliminates the need to duplicate and deploy individual configuration objects into every application namespace.
ClusterPodMonitoring: Cluster-Wide Pod Discovery
Set Relationship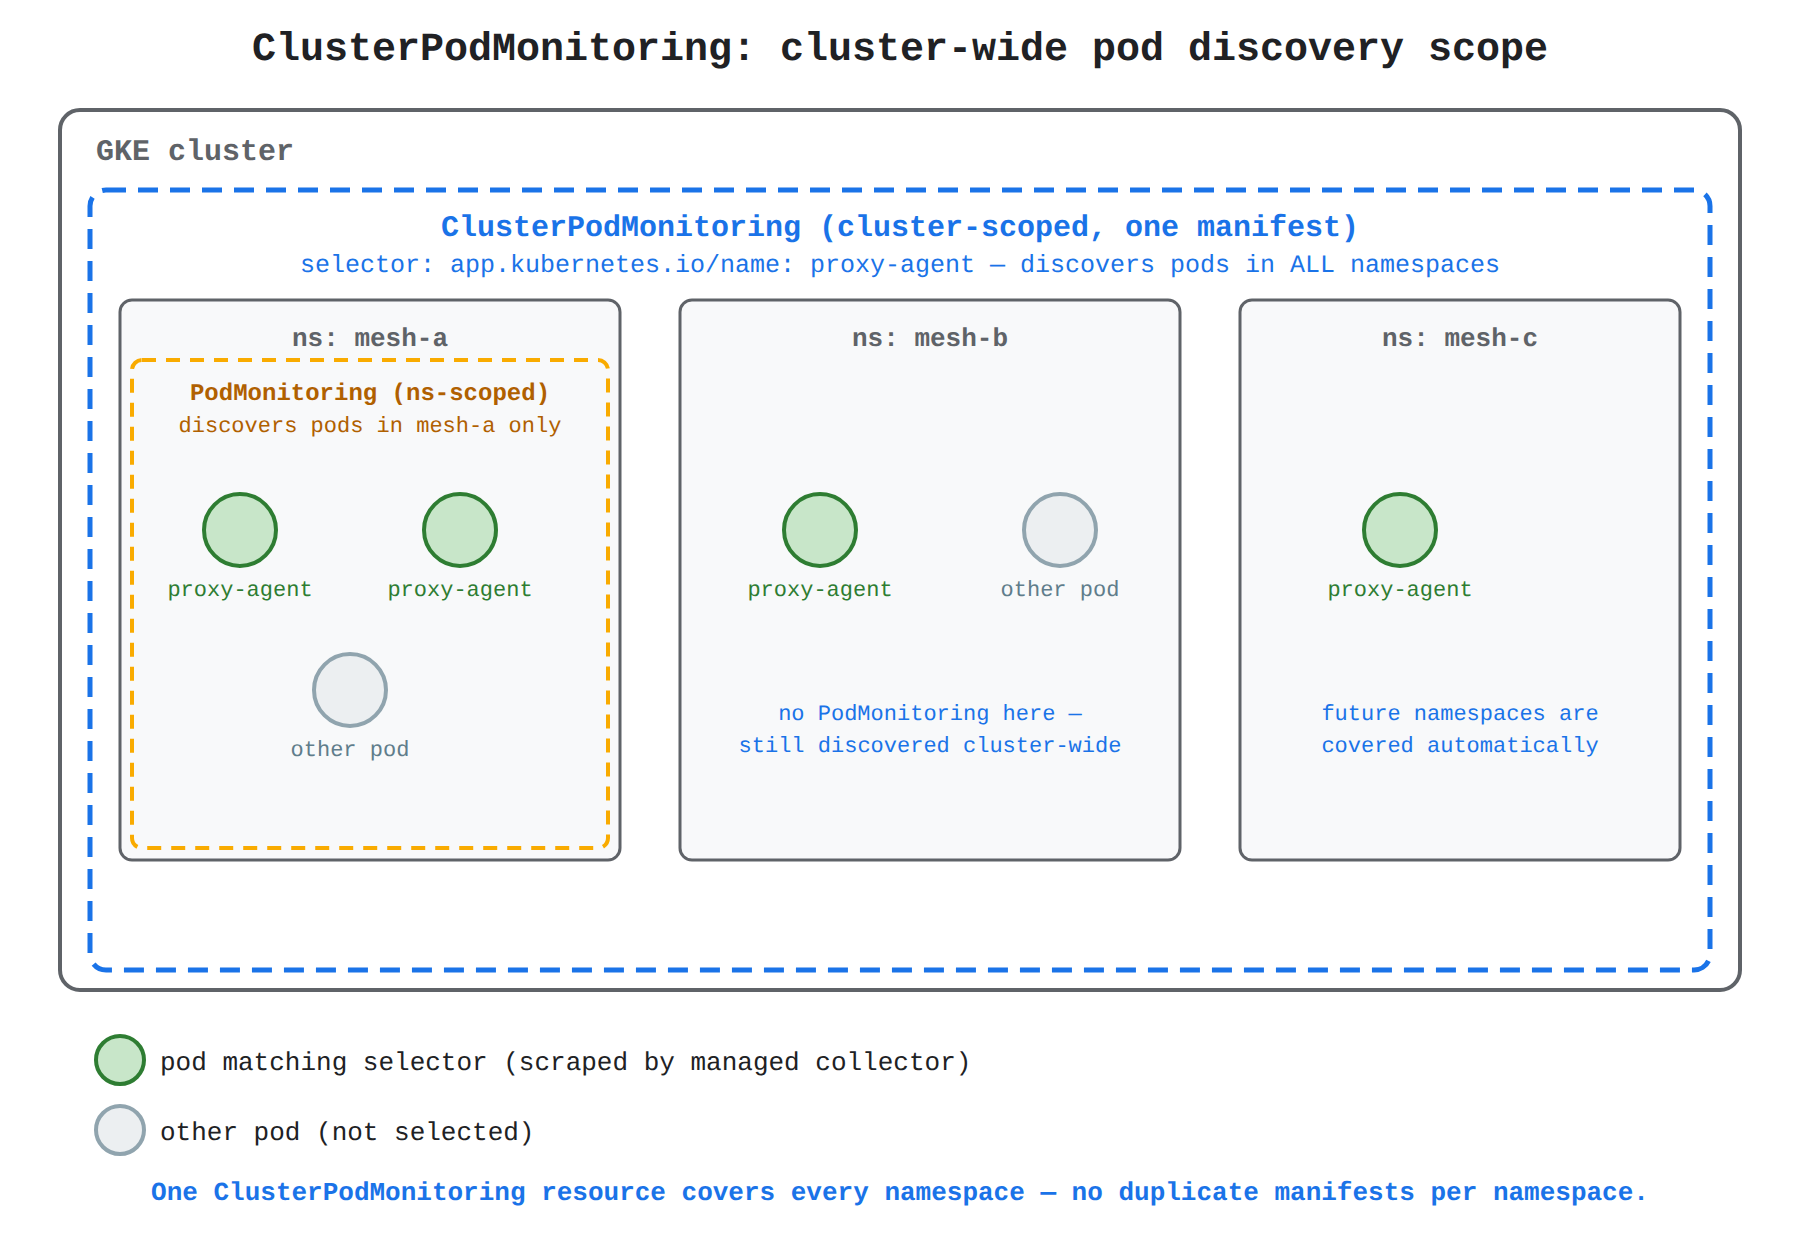
Key advantages and capabilities
- Identical interface to PodMonitoring: It shares the exact same configuration schema as
PodMonitoring, includingendpoints,interval, andmetricRelabelingsettings, while lifting the namespace restriction. - Automated target discovery: As new namespaces are created and proxy pods spin up, the managed collector automatically registers and begins scraping the new endpoints without manual intervention.
- Centralized metric relabeling: Provides Prometheus-compatible relabeling rules to filter or modify metric labels cluster-wide before ingestion into Cloud Monitoring.
- Native GKE managed collection: Works seamlessly with GKE's managed Prometheus components without requiring custom Prometheus server installations.
Why this is optimal
ClusterPodMonitoring is specifically built for shared services, daemons, and cluster-wide agents like service meshes that operate across several namespaces. Using a single resource minimizes operational overhead and prevents configuration drift.
OperatorConfig
OperatorConfig
What OperatorConfig is
OperatorConfig is a specialized custom resource utilized by Google Cloud Managed Service for Prometheus to configure operator-level settings and credentials, primarily in environments outside of Google Kubernetes Engine.
Why it doesn't meet the requirement
- Not an endpoint scraping resource:
OperatorConfigdoes not configure target scraping parameters, endpoint paths, ports, or pod label selectors. - Used for global credentials: Its primary function is to store service account credentials and export parameters in non-GKE clusters (within the
gmp-publicnamespace) to allow the collector to write metrics back to Google Cloud Monitoring.
Key characteristics and limitations
- Authentication configuration: References Kubernetes secrets that hold Google Cloud service account keys for the
roles/monitoring.metricWriterIAM role. - Non-GKE environments: GKE clusters automatically provide node service account credentials to the managed collector, making
OperatorConfigunnecessary for basic authentication on GKE. - Infrastructure-level scope: Controls collector-to-API communication rather than workload metric discovery.
This answer would be correct if
You were configuring Google Cloud Managed Service for Prometheus on a self-managed Kubernetes cluster running on-premises or in another cloud and needed to supply authentication credentials to write metrics to Google Cloud.
Additional context
Workload target discovery always relies on PodMonitoring or ClusterPodMonitoring, while administrative plumbing like OperatorConfig manages global operator connectivity.
Try 10 interactive questions like this one, free
Answer them yourself and get your score the moment you finish. No account needed.
Full access includes
- 2,014 practice questions across all 4 exam domains
- Every answer explained: why it is right, and why the others are not
- Scout, an AI tutor that answers your follow-up questions
- Readiness tracking by domain, so you know when to book the exam
Related free sample questions
Keep the momentum going with these hand-picked practice scenarios
FundamentalAssociate Cloud Engineer
Cloud Monitoring Metrics Explorer PromQL
Deploying Google Cloud Managed Service for Prometheus
FundamentalAssociate Cloud Engineer
Managed Collection vs Self-Deployed Collection
Deploying Google Cloud Managed Service for Prometheus
FundamentalAssociate Cloud Engineer
Helm Templates and Values Files
Infrastructure as code tooling (e.g., Fabric FAST, Config Connector, Terraform, Helm)
FundamentalAssociate Cloud Engineer
Cloud Billing Budget Scope Filters
Establishing billing budgets and alerts
FundamentalAssociate Cloud Engineer
Compute Engine Instance Templates
Creating an autoscaled managed instance group by using an instance template
IntermediateProfessional Cloud Architect
Llama 4 Maverick 17B-128E
Integrating AI models from Model Garden into the solution
Last updated