Fundamental
Prepare and test your skills

Fundamental
Prepare and test your skills
Ops Agent Host Metrics Collection Interval
Free sample question with answers and detailed explanation below. The Associate Cloud Engineer practice bank has an additional 2,014 practice questions.Try 10 free realistic questions: instant score, no credit card, and no account required.
An administrator manages several Linux Compute Engine instances running latency-sensitive workloads. The Google Cloud Ops Agent is installed across all instances and collects host system metrics (such as CPU, disk, and memory) at the default interval of 60 seconds. To support granular performance troubleshooting, the administrator needs to increase the sampling rate so that host metrics are collected every 30 seconds.
What should the administrator do to implement this change?
Explanations
Edit /etc/google-cloud-ops-agent/config.yaml to define a hostmetrics receiver with collection_interval set to 30s under metrics.receivers, and then restart the Ops Agent service.
Edit /etc/google-cloud-ops-agent/config.yaml to define a hostmetrics receiver with collection_interval set to 30s under metrics.receivers, and then restart the Ops Agent service.
What the Ops Agent Configuration Model Is
The Google Cloud Ops Agent manages telemetry collection on Compute Engine instances by combining Fluent Bit for logs and the OpenTelemetry Collector for metrics. Its configuration architecture relies on a built-in baseline merged with user-defined overrides. User overrides for Linux systems are placed in /etc/google-cloud-ops-agent/config.yaml. The agent configuration consists of three primary components: receivers (defining what telemetry to gather and at what interval), processors (defining how telemetry is modified or filtered), and service pipelines (connecting receivers and processors into active data flows).
Ops Agent Config Override Merge Flow
Process Flow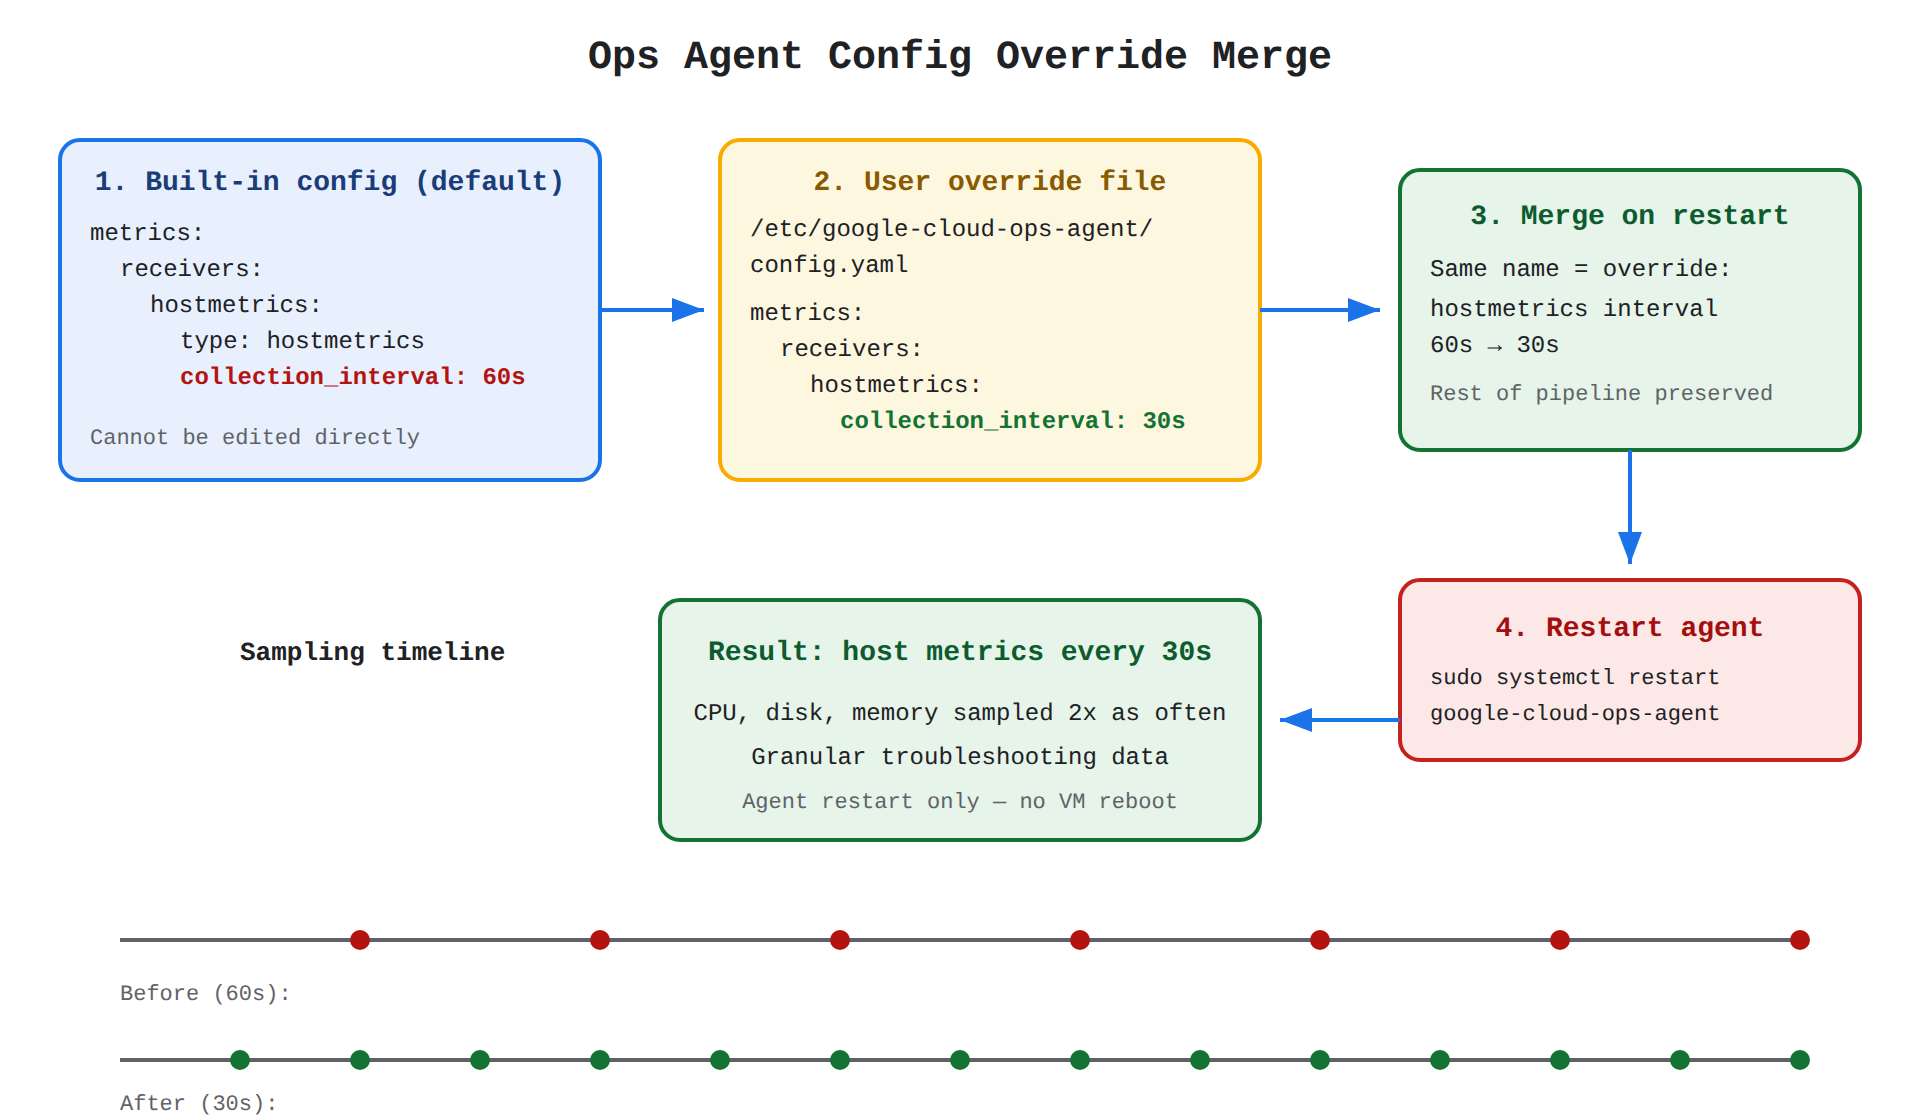
How It Meets the Requirements
To reduce the host metric collection interval from 60 seconds to 30 seconds:
- Target the receiver: Default host metric collection is handled by the built-in
hostmetricsreceiver undermetrics.receivers. - Apply the override: By declaring
hostmetricsundermetrics.receiversin/etc/google-cloud-ops-agent/config.yamlwithcollection_interval: 30s, the user configuration overrides the built-in 60-second default setting. - Restart the agent: User configurations are merged with built-in configurations during service startup. Running
sudo systemctl restart google-cloud-ops-agentapplies the new collection rate immediately.
Key Advantages and Capabilities
- Non-destructive overrides: Redefining an element by name (such as
hostmetrics) replaces only the specified attributes while preserving the rest of the built-in pipeline structure. - Granular interval tuning: Allows adjusting metric resolution (
collection_interval) according to specific workload and performance troubleshooting needs. - Clean separation of concerns: Keeps user configuration cleanly separated in
/etc/google-cloud-ops-agent/config.yamlrather than modifying internal package files. - Seamless merging: The agent automatically combines built-in telemetry rules with custom user definitions upon startup.
- Targeted service restarts: Applying configuration changes requires only a daemon restart rather than a disruptive virtual machine reboot.
Why This Is Optimal
Modifying /etc/google-cloud-ops-agent/config.yaml is the standard method for customizing the Ops Agent. It precisely targets the hostmetrics receiver where sampling frequency is configured, preserves all other default monitoring pipelines, and safely applies changes with minimal operational effort.
Directly edit the built-in configuration file at /etc/google-cloud-ops-agent/default.yaml to update the default interval, allowing the agent to detect changes without restarting.
Directly edit the built-in configuration file at /etc/google-cloud-ops-agent/default.yaml to update the default interval, allowing the agent to detect changes without restarting.
What the Built-in Configuration Is
The Google Cloud Ops Agent includes a built-in configuration that defines default behavior, including collecting standard system logs (/var/log/messages, /var/log/syslog, or Windows Event Logs) and host metrics (cpu, memory, disk, network) every 60 seconds. This built-in configuration is compiled into the agent binaries and managed internally.
Why It Doesn't Meet the Requirement
- Immutable built-in configuration: Administrators cannot directly edit the built-in configuration files. Attempting to locate and modify default internal configuration templates is unsupported and can be overwritten during package updates.
- Incorrect file location: Overrides must be defined in the dedicated user configuration file at
/etc/google-cloud-ops-agent/config.yamlon Linux. - Restart requirement: The Ops Agent does not dynamically detect configuration edits on disk. Any user-specified modifications require an explicit agent service restart to merge and activate.
Key Characteristics and Limitations
- Read-only baseline: Built-in configurations provide a safe fallback ensuring basic telemetry collection without manual setup.
- User override merging: The agent only reads user customizations from
/etc/google-cloud-ops-agent/config.yaml(Linux) orC:\Program Files\Google\Cloud Operations\Ops Agent\config\config.yaml(Windows). - Static load on boot: Configuration parsing happens exclusively during the agent daemon initialization process.
This Answer Would Be Correct If
This approach would be valid on systems or legacy tools that utilize a single editable template file with active inotify auto-reloading, but the Ops Agent explicitly forbids direct modification of built-in configurations.
Modify the default pipeline under metrics.service.pipelines.default_pipeline in /etc/google-cloud-ops-agent/config.yaml to add sampling_rate: 30s, and reboot the instance.
Modify the default pipeline under metrics.service.pipelines.default_pipeline in /etc/google-cloud-ops-agent/config.yaml to add sampling_rate: 30s, and reboot the instance.
What Pipelines and the Service Element Are
In the Ops Agent configuration model, the service section connects data sources to data processing steps. Within service, the pipelines block defines named data pathways by referencing a list of receivers and an optional ordered list of processors.
Why It Doesn't Meet the Requirement
- Invalid pipeline syntax: A pipeline definition in the
serviceblock only accepts two keys:receivers(specifying receiver IDs) andprocessors(specifying processor IDs). It does not support properties such assampling_rateorcollection_interval. - Wrong configuration level: The sampling frequency belongs to the receiver definition (
metrics.receivers.<receiver_id>.collection_interval), not the pipeline definition. - Unnecessary disruption: Applying Ops Agent configuration updates does not require rebooting the Compute Engine virtual machine. Restarting the
google-cloud-ops-agentservice withsystemctlis sufficient and avoids workload downtime.
Key Characteristics and Limitations
- Pipelines represent connections: Pipelines route collected data from one or more receivers through an ordered list of processors to Google Cloud Observability endpoints.
- Receiver responsibility: Data collection frequency, port bindings, and file paths are exclusively configured inside
receivers. - Daemon-level lifecycle: Ops Agent operations are managed as a standard Linux systemd service independent of the underlying operating system kernel or VM lifecycle.
This Answer Would Be Correct If
This approach would be appropriate if you wanted to disable metric collection entirely by overriding default_pipeline with an empty receivers list (receivers: []), or route metrics through custom processors, followed by a daemon restart.
Edit /etc/google-cloud-ops-agent/config.yaml to define a metrics_filter processor with interval set to 30s under metrics.processors, and then reload the Fluent Bit daemon.
Edit /etc/google-cloud-ops-agent/config.yaml to define a metrics_filter processor with interval set to 30s under metrics.processors, and then reload the Fluent Bit daemon.
What Processors and Fluent Bit Are
In the Google Cloud Ops Agent architecture, processors are pipeline components used to transform, parse, modify, or exclude telemetry data after it has been gathered by a receiver. Fluent Bit is the underlying open-source technology embedded within the Ops Agent specifically dedicated to high-throughput log collection and log parsing.
Why It Doesn't Meet the Requirement
- Wrong component: A processor cannot define or alter the sampling frequency of system hardware metrics. The collection interval is strictly a parameter of receivers (such as
hostmetrics), which interface directly with system resources. - Wrong engine: Fluent Bit handles log streams (such as
/var/log/syslog), not metric telemetry. The OpenTelemetry Collector handles metrics and traces within the Ops Agent. Reloading Fluent Bit would have zero effect on system metric sampling. - Invalid parameter: The built-in
metrics_filterprocessor is designed for excluding specific metric patterns (exclude_metrics), not setting collection intervals.
Key Characteristics and Limitations
- Post-ingestion processing: Processors operate strictly on data that has already been ingested by receivers.
- Log specialization: Fluent Bit manages logging receivers, parsing filters, and log routing; it does not collect CPU, memory, or disk utilization metrics.
- Processor functions: Metric processors are primarily used to filter out unneeded metric groups to optimize Cloud Monitoring ingestion costs.
This Answer Would Be Correct If
This approach would be appropriate if the goal were to filter out unwanted metric series using an exclude_metrics processor under metrics.processors to reduce Cloud Monitoring metric ingestion volume, rather than changing metric collection intervals.
Try 10 interactive questions like this one, free
Answer them yourself and get your score the moment you finish. No account needed.
Full access includes
- 2,014 practice questions across all 4 exam domains
- Every answer explained: why it is right, and why the others are not
- Scout, an AI tutor that answers your follow-up questions
- Readiness tracking by domain, so you know when to book the exam
Related free sample questions
Keep the momentum going with these hand-picked practice scenarios
FundamentalAssociate Cloud Engineer
Ops Agent Startup Script Automation
Configuring and deploying Ops Agent
FundamentalAssociate Cloud Engineer
Cloud Run Concurrency and CPU Allocation
Configuring autoscaling for a Cloud Run application
FundamentalAssociate Cloud Engineer
Kubernetes Deployment Rolling Updates
Working with Kubernetes resources (e.g., Pods, Services, StatefulSets)
FundamentalAssociate Cloud Engineer
Cloud Storage Signed URLs
Managing and securing objects in Cloud Storage buckets
FundamentalAssociate Cloud Engineer
IAM Roles at Project vs Bucket Level
Managing and securing objects in Cloud Storage buckets
FundamentalCloud Digital Leader
Cold DR Backup and Restore
Describe the importance of designing resilient, fault-tolerant, and scalable infrastructure and processes for high availability and disaster recovery.
Last updated