Intrigued by the art of cloud architecture? Discover how to design, develop, and manage robust, secure, scalable, and dynamic solutions on Google Cloud as you prepare for the Professional Cloud Architect exam!
Prepare and test your skills
Prepare and test your skills
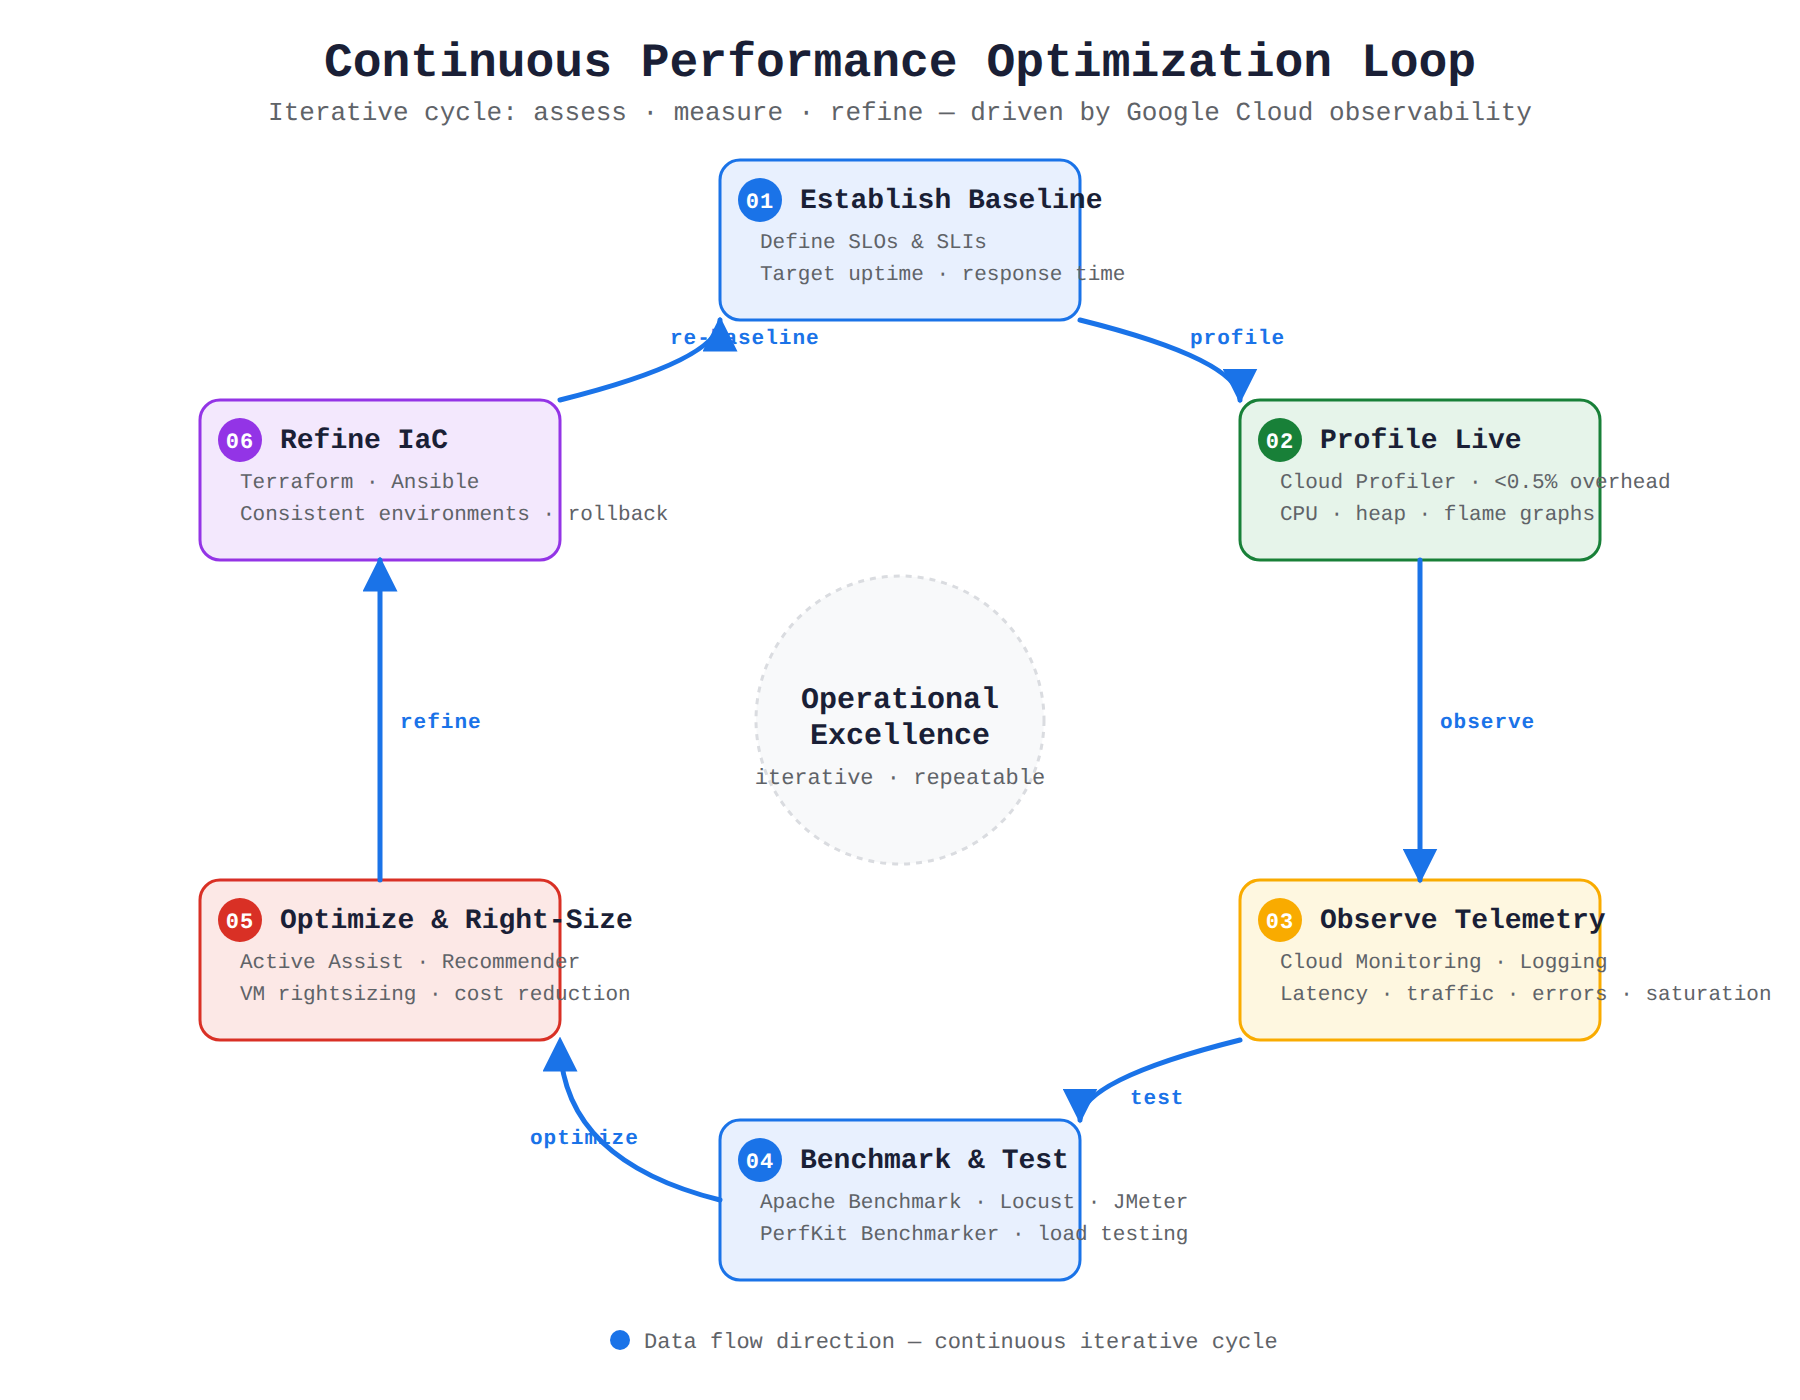
A circular flow diagram showing the continuous performance optimization loop: establish SLOs, profile live code with Cloud Profiler, observe telemetry with Cloud Monitoring, benchmark with load testing tools, optimize with Active Assist recommendations, and refine infrastructure with Terraform.
Cloud Profiler is a statistical, low-overhead tool that continuously monitors applications while they run in production, gathering information about CPU usage and memory allocation directly from the source code. It supports Go, Java, Python, and Node.js runtimes across services like Compute Engine, Google Kubernetes Engine (GKE), and App Engine.
The four golden signals are latency (the time it takes to service a request), traffic (the demand placed on the system), errors (the rate of requests that fail), and saturation (how full the service's resources are). These signals help engineers diagnose performance regressions and system issues.
For complex user simulations that require scripting and varied user paths, the summary recommends Locust or JMeter. Apache Benchmark is suggested for simple, straightforward web server testing, while Inference Quickstart is designed for benchmarking AI and machine learning workloads.
SLOs represent target performance goals like uptime or response times, while SLIs are the measurements tracked by Cloud Monitoring that indicate whether those goals are being met. Together, they establish a baseline that allows teams to compare current performance against historical trends and architectural requirements.
Cloud Profiler is a statistical, low-overhead tool that continuously monitors applications while they run in production. The service gathers information about CPU usage and memory allocation directly from the source code, helping developers identify which parts of an application consume the most resources. Because it operates with minimal impact on performance, it is safe to run in live environments to pinpoint specific code-level bottlenecks. Cloud Profiler currently supports runtimes for several popular programming languages, including Go, Java, Python, and Node.js, across services like Compute Engine, Google Kubernetes Engine (GKE), and App Engine.
To help developers analyze performance, the tool uses flame graphs to visualize how application code executes. Each frame in the graph represents a function, where the width of the frame shows how much of a resource that function is consuming within the overall call stack. Developers can filter these graphs to focus on specific routines or hide uninteresting data to speed up analysis. By establishing a process of benchmarking, development teams can compare historical trends and profiles from different time periods to ensure that code updates do not introduce new performance issues.
Continuous profiling directly supports cloud budget management by enabling the right-sizing of virtual machines and database instances. When developers optimize inefficient code, the application requires fewer compute resources or smaller instances to handle the same volume of user traffic. This proactive code-level optimization reduces unnecessary infrastructure spending and improves overall application scalability. Minimizing the resource footprint at the code level ensures that organizations only pay for the capacity they actually need to maintain operational excellence.
A performance regression occurs when a code change causes an unexpected drop in system speed or efficiency during a deployment cycle. To diagnose these regressions, engineers must correlate profiling data with system-wide telemetry provided by Cloud Monitoring and Cloud Logging. Google Cloud Observability helps teams track the four golden signals of system health:
Analyzing the resource footprint requires evaluating the total amount of compute, memory, and storage that a distributed microservices architecture needs to run effectively. Cloud tools like Active Assist and Recommender analyze these metrics automatically to provide VM rightsizing recommendations, such as suggesting smaller virtual machine types when current instances are underutilized. Adjusting resources based on these insights prevents organizations from paying for idle capacity while maintaining the performance of their distributed systems.
To ensure that benchmarking is consistent and repeatable across deployment cycles, teams use Infrastructure as Code (IaC) tools like Terraform or Ansible. Deploying testing environments through code ensures that performance tests are conducted under identical conditions, which also simplifies executing a rollback strategy if a deployment causes unexpected failures. Achieving long-term operational excellence relies on a continuous optimization loop where teams iteratively assess, measure, and refine their environments. Tools like PerfKit Benchmarker allow teams to systematically compare performance across different configurations to keep microservices cost-effective.
Infrastructure benchmarking measures how well cloud resources perform under specific workloads to ensure they meet architectural requirements. Organizations start by defining Service Level Objectives (SLOs), which represent target performance goals like uptime or response times. These objectives are tracked using Service Level Indicators (SLIs) measured by Cloud Monitoring, establishing a baseline that allows teams to compare current performance against historical trends. Profiling live environments with Cloud Profiler provides a more accurate performance baseline than laboratory testing because it captures actual user behavior with minimal system overhead.
To prepare cloud infrastructure for high traffic, teams conduct load testing to simulate many concurrent users and identify system bottlenecks where performance degrades. Different tools are selected based on the complexity of the workload:
Testing a system to its breaking point ensures that the underlying infrastructure can scale dynamically to handle sudden spikes in demand.
Benchmarking also helps engineers compare different Google Cloud machine families, such as E2 versus N1 instances, to optimize cost and performance. For network-heavy applications, tools like iperf measure bandwidth and latency, while enabling Google Virtual NIC (gVNIC) is often required to reach higher network performance tiers. Once benchmarking is complete, engineers practice capacity planning by setting Resource Requests and Resource Limits for Kubernetes containers. This prevents over-provisioning, which wastes money on unused capacity, and under-provisioning, which causes resource exhaustion and application crashes.
A financial technology company operates a containerized transaction processing service deployed across multiple Google Kubernetes Engine (GKE) clusters. During periods of peak transaction volume, the service experiences significant CPU spikes and unexpected memory exhaustion, causing aggressive pod autoscaling that substantially increases operational infrastructure costs.
While distributed tracing captures network request durations across microservices, the development team is unable to inspect call trees to determine which specific functions and methods are consuming excessive CPU, heap memory, and wall-clock execution time in production.
Which Google Cloud Observability tool should you implement to identify the code-level performance bottlenecks with minimal overhead?
 StudyCerts
 StudyCerts