Intrigued by the art of cloud architecture? Discover how to design, develop, and manage robust, secure, scalable, and dynamic solutions on Google Cloud as you prepare for the Professional Cloud Architect exam!
Prepare and test your skills
Prepare and test your skills
Alerting policies are essential tools in Google Cloud Observability that help maintain system reliability and operational excellence. An alerting policy consists of three main parts: a condition that describes when a problem is happening, an incident which is a record of the event, and a notification channel that defines how the team is contacted. By setting these up, teams can ensure proactive incident response by responding to issues before they affect users.
Metric-based alerting focuses on time-series data, such as CPU usage or memory consumption. These policies use conditions like metric thresholds to trigger alerts when values go too high or metric absence when a service stops sending data. To handle complex data, users can apply PromQL, a functional query language used to evaluate metrics in real time. Using these tools allows for accurate detection of system anomalies while keeping the infrastructure healthy.
Log-based alerting and SQL-based alerting allow teams to monitor log entry data for specific events. While log-based alerts look for a specific message or phrase in the logs, SQL-based alerts use SQL queries to analyze complex patterns or groups of data. These strategies are useful for counting how many times an error message appears, identifying trends like increasing latency in application logs, and monitoring security events or failed login attempts. These methods provide solution excellence by watching the actual text of system logs.
To make alerts effective, they must include notification channels and clear documentation. Notification channels support various integrations such as email, Slack, SMS, and PagerDuty to ensure the right people are reached. Including user-defined documentation in the alert provides links to playbooks or dashboards to help solve the problem quickly. This helps engineers resolve problems quickly by giving them the exact information they need during a crisis.
Managing these policies correctly is vital to avoid alert fatigue, which happens when too many unnecessary notifications are sent. Strategies like configuring threshold durations and alignment functions help ensure that temporary spikes do not trigger false alarms. Teams should also use snooze settings during maintenance to prevent distracting notifications. Properly tuned alerts lead to faster incident response and a more stable cloud environment.
In Site Reliability Engineering (SRE), maintaining system reliability starts with defining Service Level Indicators (SLIs), which are specific measurements of performance like availability or latency. These indicators help establish Service Level Objectives (SLOs), which represent the target values for performance over a set period. The difference between perfect performance and your SLO is known as the error budget, which allows teams to balance innovation with stability. Managing this budget effectively ensures that critical user-impact events are prioritized over minor issues.
An effective alerting policy consists of three main components: a condition, a notification channel, and documentation. The condition describes the specific state that triggers an alert, such as a metric crossing a threshold or a specific error appearing in logs. Notification channels define how the team is reached, using tools like email, Slack, or PagerDuty. Providing clear documentation within the alert helps on-call engineers troubleshoot the issue quickly by linking to internal playbooks.
Google Cloud Observability offers several ways to monitor data, including metric-based, log-based, and SQL-based alerting. Metric-based alerts track time-series data, while log-based alerts notify you when specific messages appear in your logs. For more complex needs, teams can use the Prometheus Query Language (PromQL) to create dynamic thresholds and conditional logic. Using these diverse data sources ensures that both infrastructure health and application behavior are fully visible.
When an alerting condition is met, the system creates an incident, which serves as a persistent record of the event for troubleshooting. These incidents are managed through the Cloud Monitoring console, where teams can acknowledge, snooze, or close them. Regularly testing incident management processes through methods like chaos engineering or load testing is essential for validating system resilience. This proactive approach helps identify potential bottlenecks before they affect real users.
To ensure operational excellence, organizations should follow best practices such as setting appropriate severity levels for different types of alerts. Fine-tuning alert rules is necessary to avoid alert fatigue, which happens when staff receive too many non-actionable notifications. Key strategies for maintaining a healthy alerting environment include defining clear and actionable alert messages, categorizing alerts by impact and urgency, testing alerts regularly to ensure they trigger correctly, and documenting the escalation procedures for each alert type.
Alerting strategies are essential for maintaining system reliability and operational excellence within Google Cloud. An alerting policy defines the specific conditions that trigger a notification and the steps to take when an issue occurs. When these conditions are met, Cloud Monitoring creates an incident, which serves as a permanent record for troubleshooting. This process allows teams to proactively address problems before they impact users.
To ensure that actionable information reaches the correct stakeholders, organizations should design multi-channel notification strategies. A notification channel is the medium used to deliver alerts, and Google Cloud supports several types: Email and SMS for direct messaging to individuals, Slack and PagerDuty for team-based collaboration and on-call rotations, and Webhooks and Pub/Sub for integrating with third-party tools like ServiceNow. Using multiple channels helps guarantee that critical messages are seen quickly by the right people.
Effective incident response requires more than just a notification; it needs context and guidance. You can integrate documentation directly into your alerting policies to provide step-by-step instructions for responders. This metadata can include links to internal playbooks or custom dashboards that help diagnose the specific failure. Including these resources ensures that the response is consistent and efficient across the entire organization.
Maintaining operational excellence involves fine-tuning alerts to avoid alert fatigue, which happens when too many non-critical notifications are sent. It is important to set appropriate severity levels so that urgent issues like system outages are prioritized over minor warnings. Teams should also regularly test their alerts to verify that notification channels are working correctly. Documenting the entire alerting strategy helps maintain a clear escalation procedure for all team members.
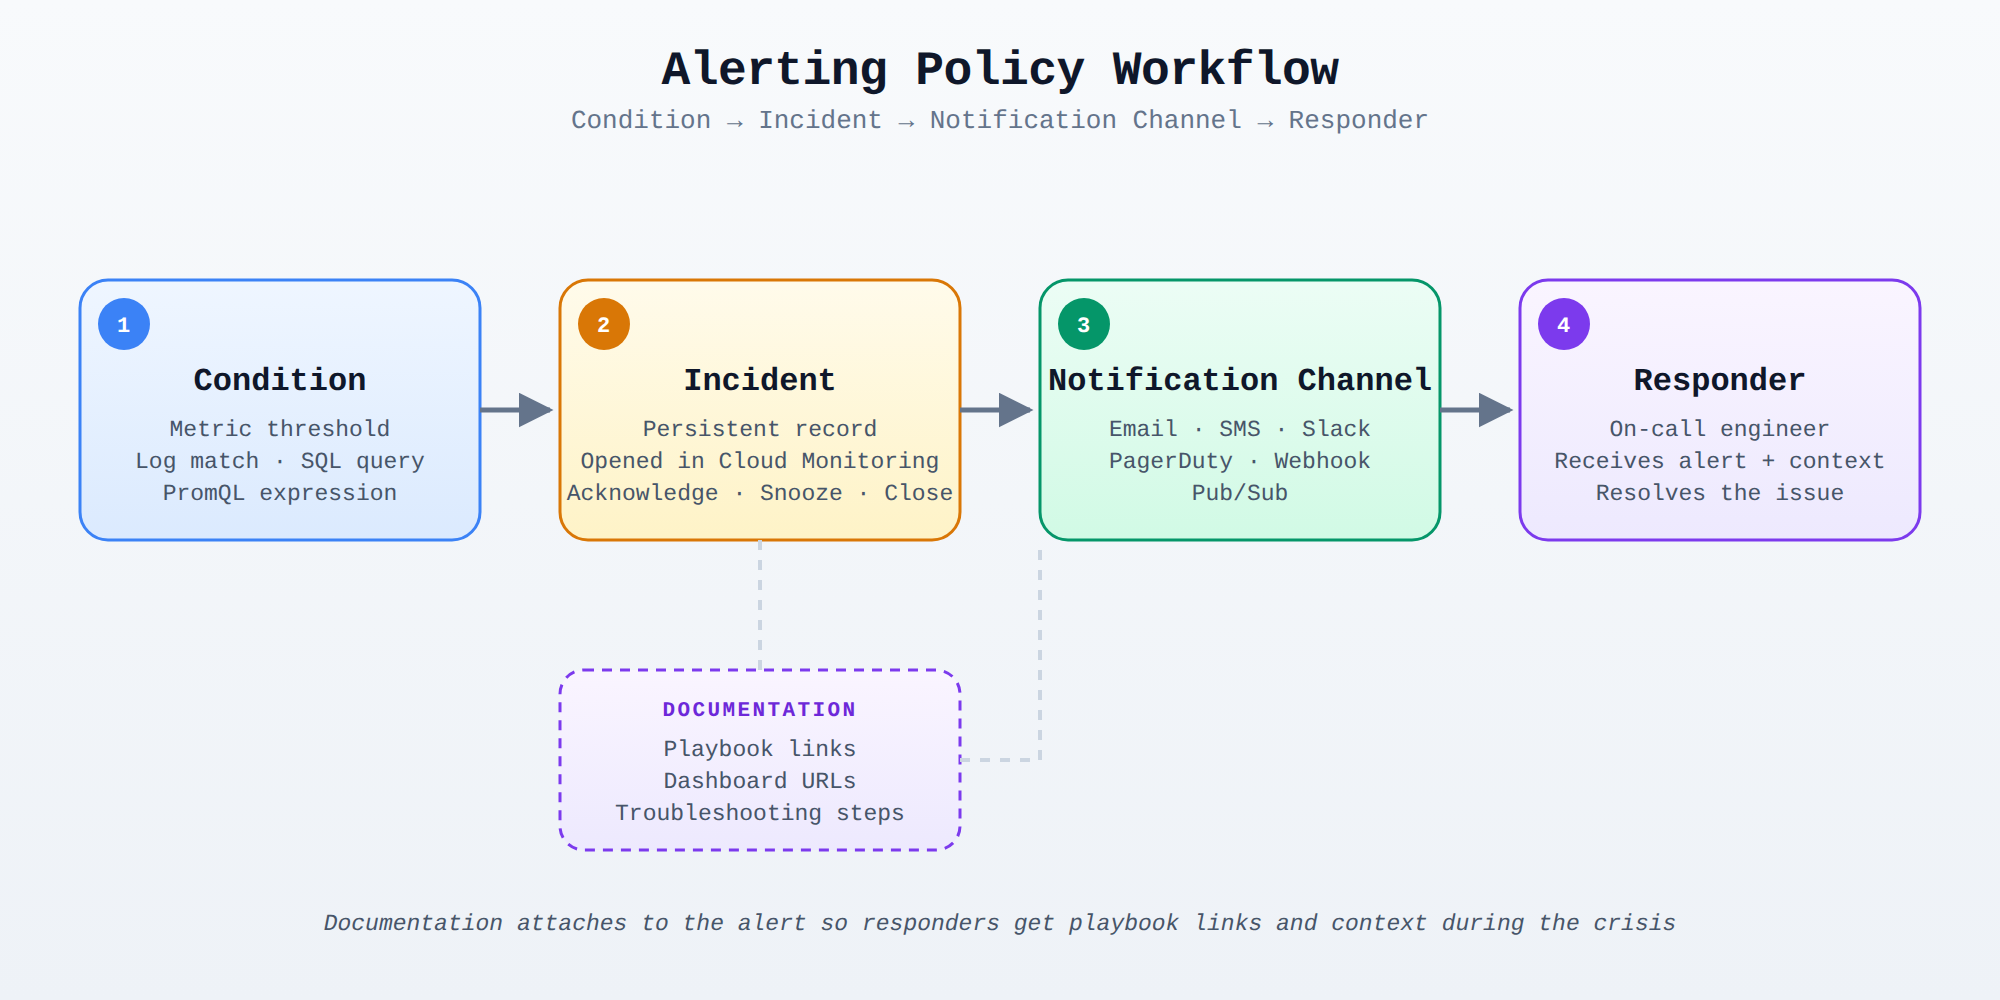
A process flow diagram showing the alerting policy workflow: a condition triggers an incident, which sends a notification through a channel to responders, with documentation attached for guidance.
An alerting policy consists of three main parts: a condition that describes when a problem is happening, an incident which is a record of the event, and a notification channel that defines how the team is contacted.
Metric-based alerting focuses on time-series data like CPU usage and uses conditions like metric thresholds, while log-based alerting monitors log entry data for specific events or messages. SQL-based alerting, which uses SQL queries to analyze complex patterns, is another method for monitoring logs.
Strategies to avoid alert fatigue include configuring threshold durations and alignment functions to prevent false alarms from temporary spikes, using snooze settings during maintenance, and setting appropriate severity levels to prioritize urgent issues over minor warnings.
Google Cloud supports notification channels such as email, SMS, Slack, PagerDuty, Webhooks, and Pub/Sub for integrating with third-party tools like ServiceNow.
An e-commerce company runs an order-processing backend on Google Compute Engine instances. The CPU utilization metric is sampled every 60 seconds. During normal operation, background memory garbage collection creates transient CPU utilization spikes of up to 90% that resolve within 45 seconds.
The operations team currently suffers from alert fatigue due to frequent false alarms triggered whenever a single measurement exceeds 85% CPU utilization. You need to configure a Cloud Monitoring metric-threshold alerting policy that ignores these transient spikes and only alerts when CPU utilization remains continuously above 85% for at least 5 minutes.
How should you configure the condition settings in Cloud Monitoring?
Set the alignment period (rolling window) to 5 minutes, configure the retest window (duration) to 0 minutes, and set the missing data evaluation policy to treat missing data as violating the condition.
Set the alignment period (rolling window) to 1 minute, configure the retest window (duration) to 0 minutes, and set the condition combiner to OR.
Set the alignment period (rolling window) to 5 minutes, select the max aligner, and configure the retest window (duration) to 0 minutes (no retest).
Set the alignment period (rolling window) to 1 minute, select the mean aligner, and configure the retest window (duration) to 5 minutes.
 StudyCerts
 StudyCerts