Fundamental
Prepare and test your skills
Fundamental
Prepare and test your skills
Continuous Monitoring and Evaluation for Generative AI
Performance metrics and drift monitoring is the continuous practice of measuring a deployed AI model and comparing its live behavior to an expected baseline. Model Monitoring on Agent Platform (opens in a new tab) tracks input data and predictions for shifts, while the Gen AI evaluation service (opens in a new tab) tracks generative output for quality and safety. When metrics cross a defined threshold, alerts in Cloud Monitoring (opens in a new tab) and Cloud Logging trigger actions such as retraining or rollback.
Why Continuous Observability Matters
Observability is the ability to see how model behavior changes over time because of new data, environment changes, or model updates. Observability is especially important for generative AI because outputs are variable and subjective, so a model can drift into bias, unsafe content, or off-topic answers without failing outright. A monitoring system therefore watches data quality, model outputs, and infrastructure health together. Insights flow from monitoring into evaluation and retraining, so reliability, accuracy, and fairness are maintained after deployment.
Key Performance Indicators and Reliability Targets
Key performance indicators (KPIs) are business outcomes that an AI system affects, such as revenue from recommendations, customer satisfaction with an assistant, or task completion rate. Each KPI depends on technical reliability metrics that can be measured from the serving system. Teams define service-level objectives (SLOs) that state an acceptable level for each technical metric from the user's perspective.
For AI applications, the four golden signals provide a shared foundation:
- Latency: time to respond to requests, including time to first token (TTFT) for large language models (LLMs).
- Traffic: volume of requests or workload handled by the endpoint.
- Error rate: rate of failed requests or operations.
- Saturation: use of CPU, memory, GPU, or TPU capacity, which shows how close the system is to its limits.
Concrete SLO targets make these signals actionable. Examples include 99.9% of API calls must return a successful response, 95th percentile inference latency must be below 300 ms, TTFT must be below 500 ms for 99% of requests, and the rate of harmful output must be below 0.1%. The model observability dashboard in Cloud Monitoring visualizes related serving metrics such as model queries per second (QPS), token throughput, and first-token latency.
Drift Monitoring With a Baseline
Drift monitoring detects when live data or predictions no longer match the conditions the model was trained for. The process starts by building a golden dataset that represents the ideal data distribution and using TensorFlow Data Validation (TFDV) to analyze training data and establish a baseline schema. Model Monitoring on Agent Platform then compares the distribution of live input data against that baseline for automatic skew detection. When the difference exceeds a custom threshold, the system sends an alert that can trigger retraining with Agent Platform Pipelines or rollback to a stable version tracked in Model Registry.
Drift Feedback Loop in 4 Steps
Process Flow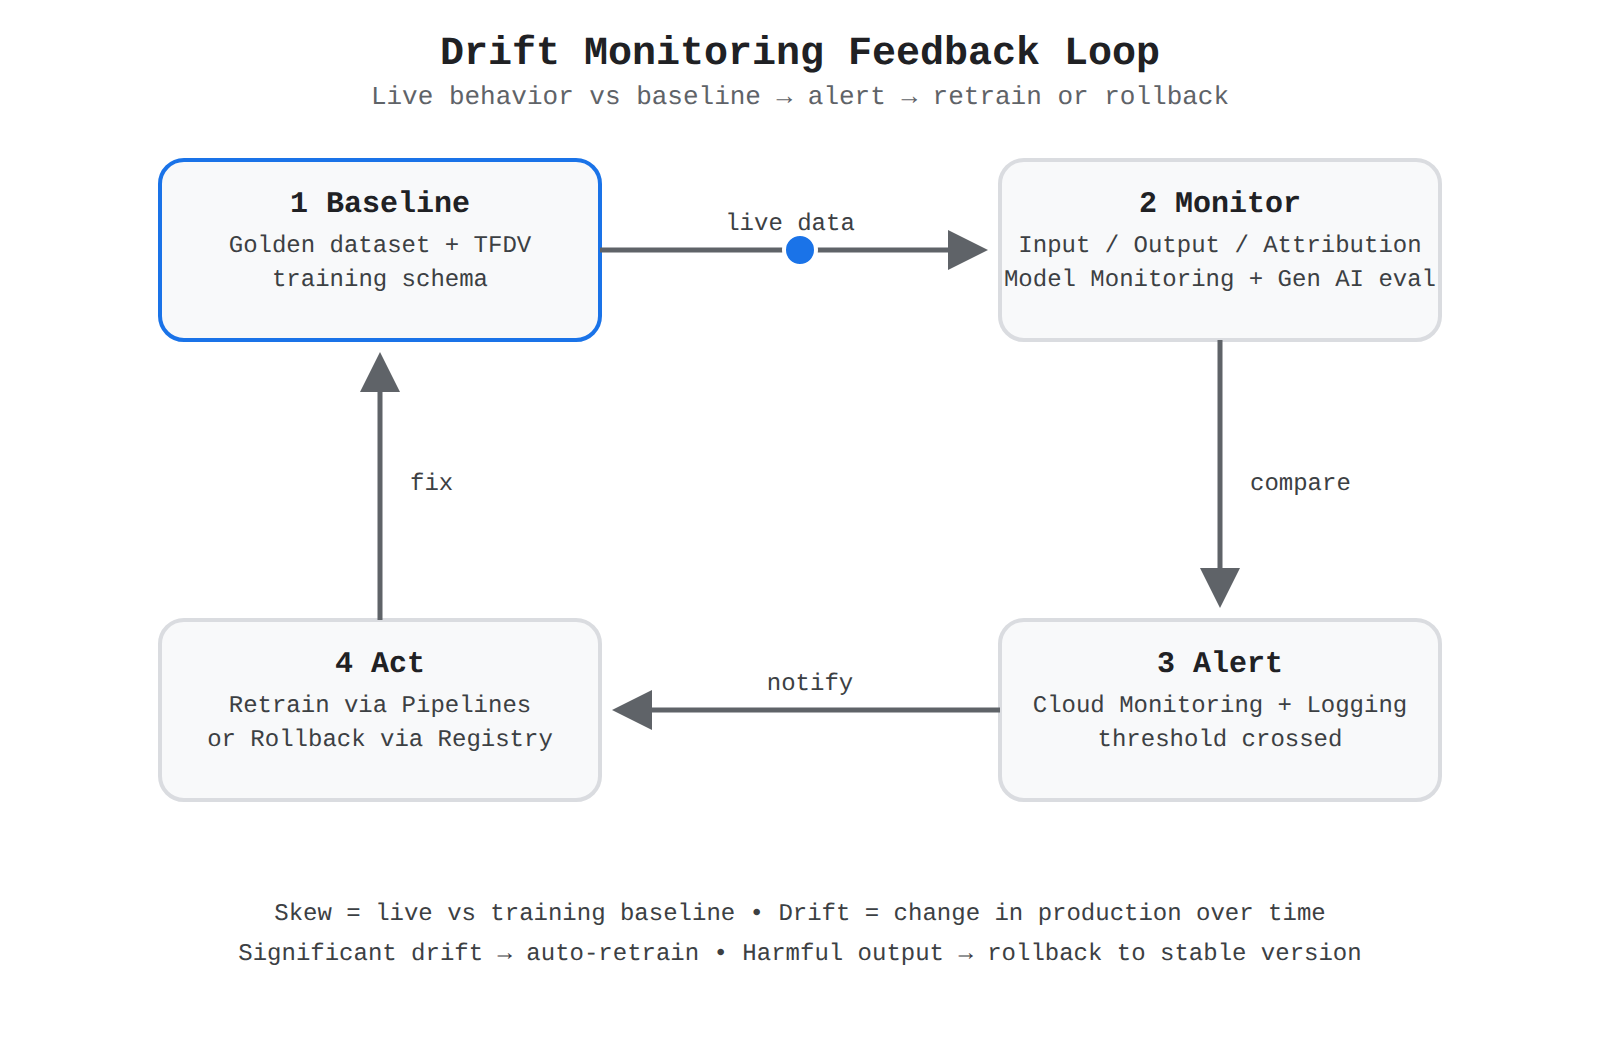
A four-step loop: baseline from golden dataset, monitor for input, output and attribution drift, alert in Cloud Monitoring, then retrain or rollback. A blue dot travels the loop in order.
The three monitoring objectives cover different places where change appears:
| Objective | What is compared | What a shift signals |
|---|---|---|
| Input feature drift | Live input features compared to baseline training or past production distribution | Data integrity change that may reduce accuracy |
| Output drift | Live prediction distribution compared to past prediction distribution | Behavior change, including spikes in low-confidence predictions |
| Feature attribution drift | Features driving predictions in production compared to baseline attributions | Model is relying on different signals than expected |
Model Monitoring on Agent Platform v2 supports these objectives for models on a managed Agent Platform endpoint and for self-hosted serving on Google Kubernetes Engine (GKE). Monitoring can be set at the model level for granular tracking rather than only at the endpoint level.
Exam tip: Training-serving skew compares live serving inputs to the training baseline, while prediction drift tracks unexpected shifts in the model's own output distribution over time.
Metrics for Traditional ML and Generative AI
Metrics for traditional machine learning (ML) and generative AI differ because one predicts labels and the other generates open-ended content. For traditional ML, Model Monitoring on Agent Platform focuses on computation-based metrics such as accuracy, precision, recall, F1-score, AUC-ROC, and log loss. A fraud model, for example, may train with cross-entropy loss but be evaluated with recall because recall measures coverage of fraudulent transactions. Thresholds for these metrics define when a model passes evaluation and when an alert should fire.
Metrics for generative AI focus on output quality, safety, and user experience in production. The Gen AI evaluation service continuously monitors output with automatic metrics for response quality, safety, instruction adherence, grounding, writing style, and verbosity. Teams also track toxicity scores, hallucination or query-resolution failure rates, input-output token counts, and user-feedback ratings. Because fluency and relevance cannot be computed by formula alone, teams add LLM-as-a-judge evaluation, where one LLM scores another model's output, and human-in-the-loop review for quality, relevance, safety, and guideline adherence. For serving stability, Gemini models expose built-in metrics such as TTFT that can be viewed in Metrics Explorer alongside throughput, latency, and error rates.
Tracking Outputs, Alerts, and Follow-Up Actions
Tracking connects model signals to operational response across the serving stack. Model Monitoring on Agent Platform watches for shifts in prediction distributions and for generative outputs that are unsafe, biased, off-topic, or malicious, and Model Armor can screen outputs for additional protection. Custom monitoring in Cloud Monitoring dashboards and log-based metrics from Cloud Logging capture application-level error patterns and quality indicators. At the same time, Cloud Monitoring tracks endpoint request rate, error rate, latency, and resource use, plus pipeline execution status for batch prediction and MLOps jobs.
When a threshold is crossed, actionable alerts notify the responsible team through channels such as email, Slack, SMS, or Pub/Sub integrations. The alert then drives a defined follow-up where the workflow depends on the finding. Significant drift or skew can start an automatic retraining pipeline, while a drop in generative quality or a spike in harmful content can trigger a rollback procedure using version lineage from Model Registry.
Lifecycle management and versioning for generative AI models on Vertex AI (opens in a new tab) is the practice of tracking a model from tuning and evaluation through inference and deployment. In Vertex AI, a model is the set of parameters and structure needed for a system to make inferences, and a managed dataset is a dataset object created in and hosted by Vertex AI. Hyperparameter tuning adjusts chosen hyperparameters within specified limits to maximize the model's predictive accuracy. Supervised Tuning Jobs can be retrieved for information or canceled, and model performance can be evaluated by defining an evaluation specification, evaluating the model, and retrieving evaluation metrics.
Vertex AI Resources in the Model Lifecycle
Vertex AI resources for the model lifecycle include models, managed datasets, supervised tuning jobs, and model evaluation slices. A model processes input data and returns output, while a managed dataset is hosted by Vertex AI. A supervised tuning job is tuning work that can be retrieved or canceled. A model evaluation slice is a portion of evaluation results retrieved with get_model_evaluation_slice. These resources connect because tuning jobs adjust models, evaluations measure model performance, and IAM controls who can manage them.
| Resource | What it is | How it connects |
|---|---|---|
| Model | Set of parameters and structure needed for inferences | Processes input data and returns output |
| Managed dataset | Dataset object created in and hosted by Vertex AI | Used as a dataset resource in Vertex AI |
| Supervised Tuning Job | Tuning work that can be retrieved or canceled | Adjusts a model using data |
| Model evaluation slice | Portion of model evaluation results | Retrieved to inspect performance |
Tracking Model Performance with Evaluations
Tracking model performance with evaluations is the ordered workflow that measures a model and retrieves its metrics for comparison. The evaluation workflow has an ordered sequence:
- Define the evaluation specification.
- Evaluate the model.
- Retrieve the evaluation metrics.
- Retrieve a model evaluation slice to inspect a specific slice of results.
For text summarization, ROUGE metrics compare a model response against a reference ground truth. These evaluation outputs help teams compare model states during iterative deployments and decide whether a model state is ready to move forward.
Tuning Jobs and Iterative Deployments
Tuning jobs create adjusted model states for iterative deployments. Hyperparameter tuning sets chosen hyperparameters within specified limits to maximize predictive accuracy. A Supervised Tuning Job can be retrieved for information or canceled if it is no longer needed. An embedding model can be fine-tuned using a pre-trained model and a specific dataset. Imagen is a text-to-image generative AI service on Vertex AI that can fine-tune style or subject models. These tuning actions produce candidate model states that can be evaluated before deployment.
Inference and Access Boundaries
Inference is running data points through a model to calculate output, and it is also called operationalizing a model or putting it into production. Vertex AI supports two inference modes that differ in what they process and how results are returned:
| Inference type | What it processes | How results are returned |
|---|---|---|
| Batch inference | A group of inference requests | Results are output in one file |
| Online inference | Individual data points | Real-time inferences |
Identity and Access Management (IAM) (opens in a new tab) permissions are granular capabilities that define who can do what on which Google Cloud resources. They are assigned to principals through roles, which control access to services and data within a Google Cloud project or organization. This boundary governs who can manage models, datasets, tuning jobs, and evaluations during lifecycle transitions.
Exam tip: Batch inference outputs a group of requests in one file, while online inference returns real-time results for individual data points.
Versioning and Seamless Transitions
Model versioning is the practice of tracking distinct model states as they move through tuning, evaluation, and deployment. In Vertex AI, tuning jobs, evaluation metrics, and model evaluation slices provide the records needed to compare those states before promotion. During automatic model upgrades and iterative deployments, these evaluation outputs help teams track performance and decide when a new model state is ready. IAM roles control who can manage those resources, so transitions stay governed.
Security and maintenance protocols for generative AI models are the ongoing operational practices that keep a deployed model protected, current, and compliant after it leaves development. On Google Cloud, these practices are built on machine learning operations (MLOps) (opens in a new tab), which the architecture guidance describes as the foundation for every AI initiative, from simple classification models to complex generative AI and agentic AI systems. Maintenance is therefore not a one-time task but a continuous cycle of delivering, operating, and securing models.
Continuous Delivery and Automation Pipelines
Continuous delivery and automation pipelines in machine learning apply continuous integration (CI), continuous delivery (CD), and continuous training (CT) to machine learning systems. CI validates model and pipeline code as changes are made, CD packages and releases a validated model into its serving environment, and CT retrains the model as new data arrives so the deployed version stays accurate over time. Together these three stages form the maintenance backbone. A model moves from changed to validated to deployed to retrained in a repeating loop rather than being frozen at release.
Operating Generative AI Applications
Operating generative AI applications means running them in production using MLOps and DevOps principles. The design guidance for this work treats building and operating as connected activities, so the same automation that ships a model also supports monitoring and updating it afterward. This matters for generative AI specifically because model behavior can shift as inputs, data, and usage patterns change. An operating practice that expects ongoing updates is what allows teams to respond.
Securing Data and Environments
Securing a generative AI workload means protecting the data it uses and the environment it runs in. Google Cloud guidance covers secure data environments that defend sensitive datasets against accidental exposure and malicious exfiltration, and landing zone security decisions that set the security design for the broader cloud environment hosting the workload. A related deployment guide shows how to build an event-driven pipeline that automatically evaluates files uploaded to Cloud Storage (opens in a new tab) for malicious code, so untrusted content is checked before it reaches downstream systems.
The security boundary here runs between the data and the model that consumes it. Controls applied to the storage and network environment protect the model indirectly by controlling what data can enter or leave. Choosing a landing zone security design and a secure data environment are therefore prerequisites for a trustworthy generative AI deployment, not separate concerns.
Enterprise Blueprints and Best Practices
Enterprise blueprints and best practices collect operational recommendations for running generative AI at scale into a repeatable process. Google Cloud provides an enterprise blueprint for building and deploying generative AI and machine learning models, along with best practices for implementing machine learning on Google Cloud and guidelines for developing high-quality, predictive ML solutions. These resources tie delivery, security, and quality together so teams can repeat the same governed process across projects.
Exam tip: MLOps is the foundation that connects continuous delivery (CI/CD/CT) to the security and operating practices that keep a deployed generative AI model current and protected.
Key Facts
- Performance metrics and drift monitoring compares live model behavior to a baseline built from a golden dataset, and alerts can trigger retraining or rollback when thresholds are crossed.
- The four golden signals for AI applications are latency, traffic, error rate, and saturation of CPU, memory, GPU, or TPU capacity.
- Model Monitoring on Agent Platform supports input feature drift, output drift, and feature attribution drift for managed endpoints and self-hosted serving on Google Kubernetes Engine (GKE).
- Vertex AI tracks lifecycle states through tuning jobs, evaluation metrics, and model evaluation slices, with batch inference returning grouped results in one file and online inference returning real-time results.
- Machine learning operations (MLOps) connects continuous integration, continuous delivery, and continuous training to the security and operating practices that keep generative AI models current and protected.
Frequently Asked Questions
What are the four golden signals for monitoring AI applications on Google Cloud and what service-level objectives (SLOs) make them actionable?
The four golden signals are latency, traffic, error rate, and saturation. Latency is time to respond to requests including time to first token (TTFT) for large language models (LLMs), traffic is volume of requests handled by the endpoint, error rate is rate of failed requests, and saturation is use of CPU, memory, GPU, or TPU capacity. Concrete service-level objectives (SLOs) make these signals actionable, such as 99.9% of API calls must return a successful response, 95th percentile inference latency must be below 300 ms, TTFT must be below 500 ms for 99% of requests, and the rate of harmful output must be below 0.1%.
What is the difference between training-serving skew and prediction drift in Model Monitoring on Agent Platform?
Training-serving skew compares live serving inputs to the training baseline, while prediction drift tracks unexpected shifts in the model's own output distribution over time. Drift monitoring starts by building a golden dataset that represents the ideal data distribution and using TensorFlow Data Validation (TFDV) to analyze training data and establish a baseline schema, then Model Monitoring on Agent Platform compares live input distribution against that baseline for automatic skew detection. When the difference exceeds a custom threshold, the system sends an alert that can trigger retraining with Agent Platform Pipelines or rollback to a stable version tracked in Model Registry.
What is the difference between batch inference and online inference in Vertex AI?
Batch inference in Vertex AI processes a group of inference requests and returns results in one file, while online inference processes individual data points and returns real-time inferences. Inference is running data points through a model to calculate output and is also called operationalizing a model or putting it into production.
Sample Question
An enterprise deploys a predictive model to a live production endpoint on Google Cloud to forecast user engagement. Over several months, consumer engagement habits gradually evolve, and the operations team is concerned that shifting input data may degrade prediction quality. The team wants to configure automated monitoring that compares the statistical distribution of incoming production features against a baseline of historical production data collected in the past.
Which monitoring feature should the team implement to identify this statistical deviation over time?
Feature attribution monitoring
Training-serving skew detection
Infrastructure latency and error rate tracking
Inference drift detection
How learners score on this domain
Last updated