Fundamental
Prepare and test your skills

Fundamental
Prepare and test your skills
Setting Up Cloud Logging and Monitoring
Deploying the Ops Agent for System Metrics means installing the Google Cloud Observability Ops Agent (opens in a new tab) on Compute Engine virtual machine (VM) instances to collect system telemetry. The Ops Agent runs on each VM and sends metric data to Cloud Monitoring (opens in a new tab) and log data to Cloud Logging (opens in a new tab). For a fleet of VMs, deployment is managed with a policy that automatically installs and keeps the agent current on matching instances.
What the Ops Agent Collects
The Ops Agent is a single agent that combines logging and metrics collection for Compute Engine instances. The Ops Agent uses YAML-based configuration and high-throughput logging to handle detailed system and application telemetry from the VM. Telemetry flows from the Ops Agent on the VM to Cloud Monitoring for metric data and to Cloud Logging for storage, search, and analysis. This combined flow lets operators monitor performance, visualize behavior, and investigate VM issues from one set of observability services.
Exam tip: Use the Ops Agent for Compute Engine instances, and use Bindplane for on-premises and hybrid-cloud systems and applications.
Prerequisites for the Ops Agent
Prerequisites for the Ops Agent are the project API, VM identity, and permissions that let the agent write telemetry. Google Cloud services are disabled by default, so the Compute Engine API (compute.googleapis.com) must be enabled before VMs and agent policies can be used. Each VM needs the cloud-platform access scope, which is set in the Identity and API access section when creating an instance, and Google recommends custom service accounts with permissions granted through Identity and Access Management (IAM) roles.
The VM service account must be able to write metrics, logs, and traces:
- Monitoring Metric Writer (
roles/monitoring.metricWriter) lets the agent write metric data to Cloud Monitoring. - Logs Writer (
roles/logging.logWriter) lets the agent write log entries to Cloud Logging. - Cloud Trace Agent lets the VM write trace data when tracing is used.
The Compute Engine default service account usually has these roles, but a user-managed service account must be assigned the same roles to support the Ops Agent.
Install and Maintain the Ops Agent at Scale
A VM Extension Manager policy, also described as an agent policy, automatically installs and maintains the Ops Agent across a fleet of VMs. The policy depends on target selectors to decide which VMs receive the agent, so only matching instances are managed. Group labels such as env, app, and created_by select VMs by their labels, while OS types such as short name centos and version 8 select VMs by operating system. This targeting means new VMs that match the labels and OS type are brought under management without installing the agent one VM at a time.
The agent rule inside the policy defines the desired state of the Ops Agent on each targeted VM. The rule sets the type to ops-agent, the package state to installed, and the version to current-major with autoupgrade enabled, so the fleet stays current on the major version. Once applied, the management flow runs from the policy to each matching VM, and the VM then runs the Ops Agent to collect telemetry. Because the policy maintains the desired state, missing or outdated agents on matching VMs are corrected automatically.
How Telemetry Appears in Monitoring and Logging
Telemetry from the Ops Agent becomes visible after the agent starts sending data to Cloud Monitoring and Cloud Logging. Cloud Monitoring collects metric data and provides tools to monitor and visualize how applications and services are performing, including charts, dashboards, and alerting policies. Cloud Logging is a fully managed service that stores, searches, analyzes, and monitors logging data and events, including support for alerting on log data. Together, these destinations turn agent data from individual VMs into fleet-wide operational health and resource oversight.
VM telemetry can be checked by looking for the VM resource in each service. In Cloud Monitoring, agent metrics appear for charting and for VM dashboards that can be viewed and customized. In Cloud Logging, VM entries can be viewed in Logs Explorer by selecting the GCE VM Instance resource type for Compute Engine workloads. If no logs appear, switching Logs Explorer to an advanced filter with an empty query shows all log entries so the correct resource can be identified.
Configuring Cloud Logging (opens in a new tab) and data export means setting up where logs are stored and how they are routed for long-term use. Logs are held in a log bucket (opens in a new tab), which controls how long entries are kept, while a log sink routes copies of logs to other destinations. Together, buckets for storage and sinks for export give a project both operational visibility and durable telemetry history.
Try the scenario
Log retention limits and sink export routing in Cloud Logging
Change the inputs and watch how the outcome changes.
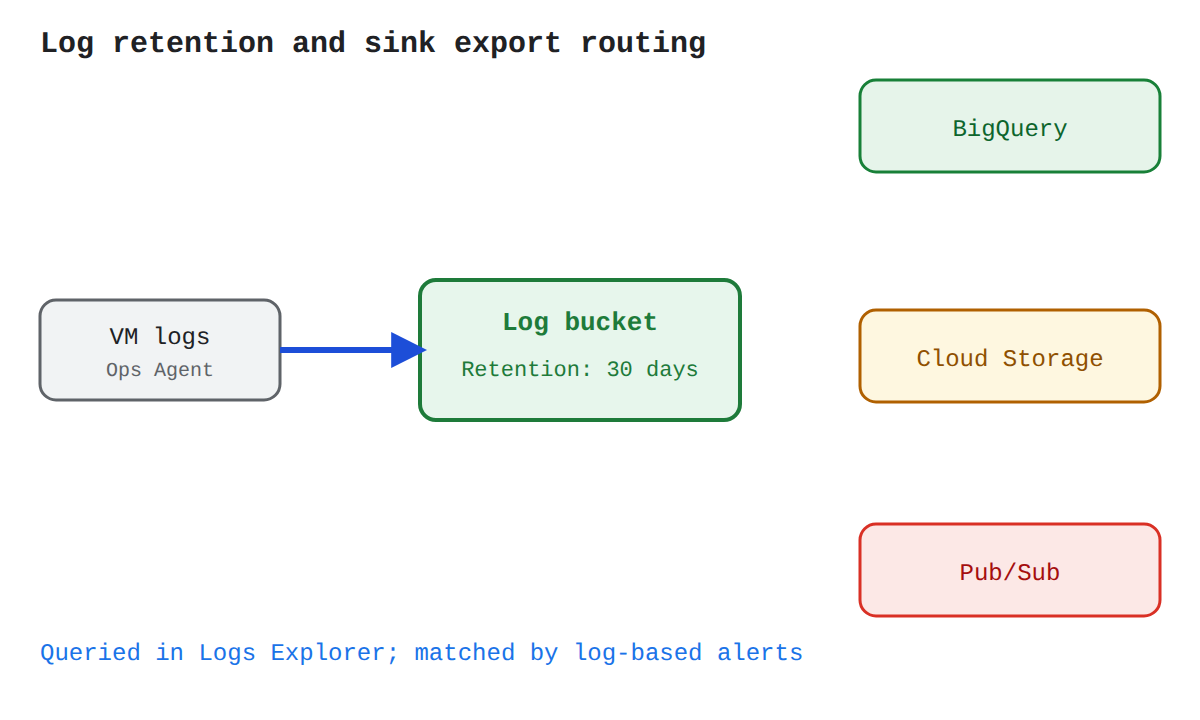
Change the retention period and downstream requirement to see when logs stay in a log bucket, when a linked dataset works, and when a sink export is required.
Enable the Observability API
The Observability API (observability.googleapis.com) is the API that must be enabled before managing observability storage such as buckets, datasets, views, and links. Enabling requires a Google Cloud project with billing enabled and the Identity and Access Management (IAM) permission serviceusage.services.enable, which is included in the Owner role and the Service Usage Admin role. Creating a project itself requires the Project Creator role.
- Select or create a project: Select any project you have a role on, or create a new project if you do not want to keep the resources.
- Verify billing: Confirm that billing is enabled for the selected Google Cloud project.
- Enable the API: Enable the Observability API in the project, using the console enable flow, Google Cloud CLI, Terraform, or REST.
Listing stored buckets, datasets, views, and links requires the Observability Viewer role, while updating buckets requires the Observability Editor role. For command-line management, use Google Cloud CLI version 586.0.0 or later, often through Cloud Shell where the CLI and project values are already set.
Manage Log Storage Buckets
A log bucket is the storage container that holds log entries and enforces how long they are retained. Cloud Logging retains logs according to the retention rule of the bucket where the logs are held, and custom retention can be configured between 1 day and 3650 days to meet compliance needs. An observability bucket is also the management entity for datasets, which store data, along with views for filtered access and links for SQL analysis.
Custom retention in Cloud Logging applies to all logs in a bucket, regardless of log type or whether a log was copied from another location. By default, Cloud Logging encrypts stored content at rest, and organizations with advanced requirements can instead configure customer-managed encryption keys (CMEK) to control their own key encryption keys. Managing buckets, datasets, views, and links is done through the Observability API or Google Cloud CLI, with Terraform also supported for creating links.
Exam tip: A custom retention rule covers an entire log bucket for 1 to 3650 days; it cannot set different retention for individual log types inside the same bucket.
Export Logs with Sinks
A log sink is a routing rule that sends some or all logs from Cloud Logging to a supported destination outside the original bucket. The sink evaluates incoming log entries and forwards matching entries to the destination, where the destination service then applies its own storage and pricing. Sinks are used when an organization must preserve audit logs, keep data longer than bucket retention, or analyze telemetry with other tools.
Log sinks export telemetry data to three peer destinations:
- BigQuery: Send log data to BigQuery for SQL analysis, joining logs with other datasets, and building long-term analytics.
- Cloud Storage: Send log data to Cloud Storage for low-cost, durable archival and compliance preservation.
- Pub/Sub: Send log data to Pub/Sub for real-time delivery to other applications and processing pipelines.
A linked BigQuery dataset can also connect stored observability data to BigQuery so queries can join log data with other BigQuery datasets, run from BigQuery Studio, use BigQuery reserved slots, or feed a SQL-based alerting policy. Observability Analytics can query log data with SQL without a linked dataset, but the link is required for those extended BigQuery uses.
View and Monitor Logs
Logs Explorer is the Google Cloud console page for retrieving and querying audit log entries for an organization. Queries select a resource type and a log name, such as activity for Admin Activity logs, data_access for Data Access logs, system_event for System Event logs, and policy for Policy Denied logs. If a log type option does not appear, no logs of that type are available in the organization.
To view audit logs in Logs Explorer:
- Open Logs Explorer: Go to the Logs Explorer page in the Google Cloud console and select your organization.
- Select resource type: Choose the Google Cloud resource whose audit logs you want to see.
- Select log name: Choose activity, data_access, system_event, or policy for the audit log type.
- Run query: Refine the entries in the query editor if needed, then click Run query.
Cloud Monitoring receives data from logs through log-based alerting policies, which notify operators anytime a specific event appears in a log. A policy matches a described condition in the log stream, so teams can separate events that need immediate investigation from low-priority events. For example, a policy can match a particular data-access message in an audit log and send a notification each time that message appears.
Implementing monitoring dashboards and uptime checks means using Cloud Monitoring (opens in a new tab) to see how resources are performing and to verify that public services stay reachable. Cloud Monitoring collects metric data from Google Cloud services and applications and provides visualization and proactive testing tools. Dashboards visualize that metric data as charts, while uptime checks actively probe endpoints for responsiveness.
Custom Monitoring Dashboards
A custom dashboard in Cloud Monitoring is a user-created view that controls exactly which metric data is shown and how it is displayed. Metric data flows from Google Cloud resources and applications into Cloud Monitoring, and the dashboard service renders that data as charts for analysis. Use custom dashboards to see trends over time, identify outliers, and combine related charts in one place for resource utilization and application health.
Google Cloud Observability (opens in a new tab) also creates Google Cloud-managed dashboards automatically when resources are created or when applications are registered with App Hub. A managed dashboard shows curated information such as log data, metric data, and the number of open alerts for an application and for each of its services and workloads. Managed dashboards are useful for a quick health check, while a custom dashboard is needed when the managed view does not show the exact metrics or layout required.
To ensure comprehensive monitoring, custom dashboards typically visualize system health indicators and application performance metrics:
- CPU utilization
- Memory usage
- Network traffic
- Disk I/O
- Application response times
| Dashboard type | Who creates it | Choose when |
|---|---|---|
| Google Cloud-managed dashboards | Cloud Monitoring creates it automatically for resources and App Hub applications | A curated view of health, logs, metrics, and open alerts is enough |
| Custom dashboard | You create it and select metrics and chart formats | You need to track trends, spot outliers, or view specific resource utilization |
Uptime Checks for Availability and Responsiveness
An uptime check in Cloud Monitoring is a synthetic monitor that tests the availability, consistency, and performance of a service, web page, or API. Probe traffic flows from Google Cloud checkers to a public HTTP, HTTPS, or TCP endpoint, and the results flow back into Cloud Monitoring as monitoring data. Because the check originates outside the application, it verifies what an external user experiences, including whether the endpoint responds and how quickly it responds.
Uptime checks depend on alerting policies to notify people when an endpoint fails to respond. When a check detects a failure, Cloud Monitoring can trigger a notification through channels such as email, mobile app, PagerDuty, or Slack. A related synthetic monitor is the broken-link checker, which crawls a web page and notifies you when broken links are detected. You can create and manage synthetic monitors by using the Google Cloud console, the Cloud Monitoring API, the Google Cloud CLI, or Terraform.
Exam tip: Use a custom dashboard to visualize internal metric data such as CPU and memory, and use an uptime check to verify external availability of an HTTP, HTTPS, or TCP endpoint.
Key Facts
- The Google Cloud Observability Ops Agent runs on Compute Engine virtual machines and sends metrics to Cloud Monitoring and logs to Cloud Logging.
- A VM Extension Manager policy installs and maintains the Ops Agent on VMs selected by labels and operating system, with version set to current-major and autoupgrade enabled.
- A log bucket controls retention for all logs it holds for 1 to 3650 days, while a log sink routes matching logs to BigQuery, Cloud Storage, or Pub/Sub.
- Logs Explorer queries audit logs by resource type and log name, including activity, data_access, system_event, and policy.
- An uptime check probes a public HTTP, HTTPS, or TCP endpoint from Google Cloud checkers and uses an alerting policy to notify through channels such as email, PagerDuty, or Slack.
Frequently Asked Questions
When should I use the Google Cloud Observability Ops Agent instead of Bindplane?
Use the Google Cloud Observability Ops Agent for Compute Engine virtual machine (VM) instances to collect system telemetry, and use Bindplane for on-premises and hybrid-cloud systems and applications. The Ops Agent runs on each VM and sends metric data to Cloud Monitoring and log data to Cloud Logging.
What permissions does a Compute Engine virtual machine (VM) service account need to support the Google Cloud Observability Ops Agent?
The VM service account must have the Monitoring Metric Writer role to write metric data to Cloud Monitoring, the Logs Writer role to write log entries to Cloud Logging, and the Cloud Trace Agent role to write trace data when tracing is used. Each VM also needs the cloud-platform access scope and the Compute Engine API enabled before VMs and agent policies can be used.
What is the difference between a log bucket and a log sink in Cloud Logging?
A log bucket is the storage container that holds log entries and enforces retention for all logs it holds between 1 day and 3650 days, while a log sink is a routing rule that sends matching logs to another destination. Sinks export to BigQuery for SQL analysis, Cloud Storage for low-cost durable archival, and Pub/Sub for real-time delivery, where the destination service applies its own storage and pricing.
How do uptime checks in Cloud Monitoring verify service availability?
An uptime check in Cloud Monitoring is a synthetic monitor that probes a public HTTP, HTTPS, or TCP endpoint from Google Cloud checkers and returns the results to Cloud Monitoring as monitoring data. When a check detects a failure, an alerting policy notifies people through channels such as email, mobile app, PagerDuty, or Slack.
Sample Question
An administrator creates several new Compute Engine virtual machines running Linux in a Google Cloud project. In the Google Cloud console Observability dashboard, basic hypervisor metrics like CPU utilization and network traffic appear normally, but the charts for guest memory utilization and disk space utilization display no data.
What should the administrator do to collect these operating system-level metrics and system logs from the virtual machines?
How learners score on this domain
Last updated