Fundamental
Prepare and test your skills

Fundamental
Prepare and test your skills
Why Dataflow Streaming Autoscaling Stops Scaling
Free sample question with answers and detailed explanation below. The Associate Cloud Engineer practice bank has an additional 2,014 practice questions.Try 10 free realistic questions: instant score, no credit card, and no account required.
An administrator is monitoring an active Cloud Dataflow streaming pipeline that uses Streaming Engine. During a sudden surge in incoming traffic, message latency increases and an unprocessed backlog accumulates, but Dataflow stops provisioning additional worker instances.
Which chart in the Dataflow monitoring interface should the administrator inspect to determine the specific reason the autoscaler did not provision more workers?
Explanations
The Worker CPU utilization chart
The Worker CPU utilization chart
What the Worker CPU Utilization Chart Is
The Worker CPU utilization chart displays the average and peak CPU consumption across all active Compute Engine worker instances in a Dataflow pipeline over time. It allows operators to see whether worker instances are CPU-bound or underutilized.
Why It Doesn't Meet the Requirement
While high CPU utilization serves as an input signal to trigger autoscaling, the chart itself only displays hardware performance data. It cannot explain the internal logic of the autoscaler or clarify why scaling halted when limits are reached.
Key Characteristics and Limitations
- Metric display: Shows processor usage percentages across the worker pool.
- Symptom indicator: Demonstrates whether individual workers are overburdened.
- Lack of rationale: Does not disclose configured constraints like maximum worker quotas or key-parallelism bottlenecks.
This Answer Would Be Correct If
The objective was to verify whether the pipeline's computational logic is consuming high processor capacity or if workers are sitting idle due to I/O bottlenecks.
The Execution graph step throughput view
The Execution graph step throughput view
What the Execution Graph Step Throughput View Is
The Execution graph visualizes the directed acyclic graph (DAG) of transforms within a Dataflow pipeline, showing metrics such as input/output throughput rates, processing times, and system lag for individual transforms.
Why It Doesn't Meet the Requirement
Inspecting individual graph steps helps identify specific transforms that are slow, but it does not detail worker provisioning logic or explain why the cluster autoscaler stopped adding Compute Engine VMs.
Key Characteristics and Limitations
- Transform-level metrics: Displays records per second and byte processing speeds per transform.
- Pipeline topology: Outlines how data flows through various parallel steps.
- No cluster-level scaling logs: Excludes cluster-level worker limits, scaling rationale, and provisioning decisions.
This Answer Would Be Correct If
The administrator needed to pinpoint which individual transform step was creating a bottleneck within the pipeline code.
The Autoscaling rationale chart
The Autoscaling rationale chart
What the Autoscaling Rationale Chart Is
The Autoscaling rationale chart in Cloud Dataflow provides insight into the automated decision-making process of the Dataflow autoscaler for Streaming Engine jobs. It visualizes whether the autoscaler chose to scale up, scale down, or keep the worker pool size unchanged during specific time windows.
How It Meets the Requirement
When a pipeline experiences an increasing backlog and rising latency, Dataflow typically scales out worker instances to handle the throughput. If worker growth halts despite a growing backlog, the Autoscaling rationale chart displays the explicit reason behind the decision. By hovering over data points in the chart, administrators can view descriptions such as:
- Hit non-resource related limit: The pipeline reached a maximum worker limit or is constrained by key parallelism.
- Gathering more data for decision: Fluctuating signals or recent pool updates require Dataflow to stabilize before resizing.
- Actively scaling: The autoscaler is currently waiting for newly provisioned resources to initialize.
Why Autoscaler Paused Despite Backlog
Decision Tree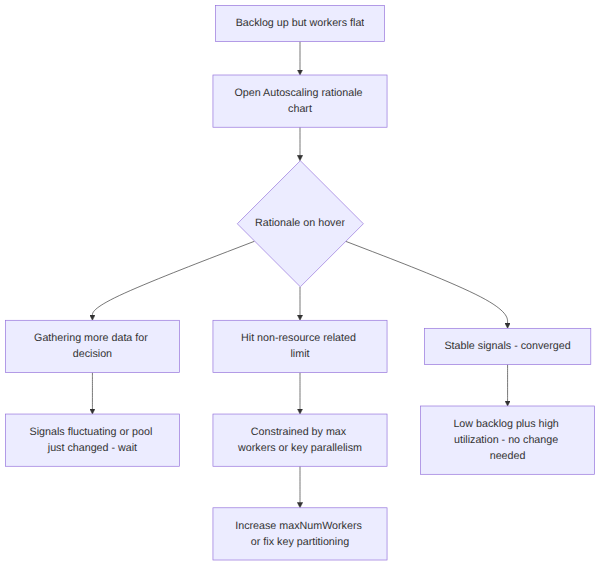
Key Advantages and Capabilities
- Root-cause analysis: Pinpoints why autoscaling paused even when workload metrics demand more capacity.
- Bottleneck identification: Helps distinguish between infrastructure constraints (e.g., maximum worker caps) and application constraints (e.g., poorly partitioned keys).
- Integrated timeline: Correlates scaling decisions directly with worker counts and traffic spikes.
- Actionable diagnostics: Provides actionable guidance for tuning pipeline parameters, such as increasing
--maxNumWorkers.
Why This Is Optimal
While raw operational metrics show symptoms like high utilization or backlogs, the Autoscaling rationale chart is the only monitoring tool that directly explains the operational decisions of the autoscaler engine.
The Backlog metric chart
The Backlog metric chart
What the Backlog Metric Chart Is
The Backlog metric chart (available for Streaming Engine pipelines) tracks the estimated volume of unprocessed data remaining in the input queue over time, measured in seconds of throughput or byte volume.
Why It Doesn't Meet the Requirement
The backlog chart illustrates that a queue is accumulating, confirming that the pipeline is falling behind. However, it does not provide the underlying rationale for why the autoscaler declined to add more workers.
Key Characteristics and Limitations
- Queue visibility: Visualizes the growth or depletion of unacknowledged data.
- Signal measurement: Serves as a primary input trigger for autoscaling algorithms.
- No policy context: Lacks visibility into autoscaling policy constraints, quotas, or key distribution limits.
This Answer Would Be Correct If
The administrator needed to measure the total amount of unread data waiting in an upstream messaging system to evaluate SLA compliance.
Try 10 interactive questions like this one, free
Answer them yourself and get your score the moment you finish. No account needed.
Full access includes
- 2,014 practice questions across all 4 exam domains
- Every answer explained: why it is right, and why the others are not
- Scout, an AI tutor that answers your follow-up questions
- Readiness tracking by domain, so you know when to book the exam
Related free sample questions
Keep the momentum going with these hand-picked practice scenarios
FundamentalAssociate Cloud Engineer
bq show --job=true Job Inspection
Reviewing job status (e.g., Dataflow, BigQuery)
FundamentalAssociate Cloud Engineer
Promoting Ephemeral IP to Static
Reserving static external or internal IP addresses
FundamentalAssociate Cloud Engineer
Service Accounts for Non-Human Workloads
Granting members Identity and Access Management (IAM) roles within a project
FundamentalAssociate Cloud Engineer
Eventarc Cloud Run Invoker Role
Deploying an application to serverless compute platforms, including for the processing of Google Cloud events (e.g., Pub/Sub events, Cloud Storage object change notification events, Eventarc)
FundamentalAssociate Cloud Engineer
Static Internal IP Primary CIDR Requirement
Reserving static external or internal IP addresses
FundamentalCloud Digital Leader
Mission Critical Services vs Premium Support
Describe how organizations benefit from using Google Cloud Customer Care to support their cloud adoption.
Last updated