Fundamental
Prepare and test your skills

Fundamental
Prepare and test your skills
Adding Runbooks to Cloud Monitoring Alerts
Free sample question with answers and detailed explanation below. The Associate Cloud Engineer practice bank has an additional 2,014 practice questions.Try 10 free realistic questions: instant score, no credit card, and no account required.
Your operations team is configuring a Cloud Monitoring alerting policy to detect when virtual machine (VM) instances experience sustained high CPU utilization.
You must satisfy the following operational requirements:
- The team must receive immediate alert notifications through both email and their Slack channel.
- The notifications must include actionable troubleshooting steps and links to internal runbooks so that on-call engineers can resolve the issue quickly.
How should you configure the alerting policy?
Explanations
Configure Email and Slack notification channels, but embed the troubleshooting steps into the metric threshold filter expression.
Configure Email and Slack notification channels, but embed the troubleshooting steps into the metric threshold filter expression.
What Metric Threshold Filters Are and Do
A metric threshold filter is a technical expression used in an alerting policy condition to define which time-series metrics Cloud Monitoring should evaluate. Filters use specific key-value syntax to constrain data collection by criteria like resource.type, metric.type, or custom metadata labels (such as zone or instance group name).
Why It Doesn't Meet the Requirements
- Invalid syntax: Metric filter fields only accept valid resource descriptors, metric types, and comparison operators. Entering free-form troubleshooting instructions or runbook URLs will cause validation errors and prevent the alerting policy from saving.
- Cannot deliver documentation: Metric filters are evaluated internally by the metric processing engine; they do not format or deliver human-readable instructions to notification targets.
- Misaligned functionality: Filters are designed strictly for mathematical evaluation and data segmentation, not for incident documentation or communication.
Key Characteristics and Limitations of Metric Filters
- Strict query formatting: Must adhere to Google Cloud Monitoring filter syntax or PromQL/MQL standards.
- Data selection only: Used solely to determine which resources and metrics are monitored.
- No rich text capability: Cannot store Markdown, user-facing commentary, or interactive URLs.
This Answer Would Be Correct If
The requirement was to narrow down the alert condition so that it only evaluated virtual machine instances belonging to a specific environment, such as filtering for metadata.user_labels.environment = "production".
Add the troubleshooting instructions to the policy's documentation field, but omit notification channels so the alerting policy fires silently.
Add the troubleshooting instructions to the policy's documentation field, but omit notification channels so the alerting policy fires silently.
What Silent Alerting Is and Does
In Cloud Monitoring, creating an alerting policy without assigning any notification channels configures the policy to fire silently. When metric thresholds are breached, Cloud Monitoring registers the incident and displays it within the Incidents list in the Google Cloud console, but it sends no external notifications to individuals or team chat channels.
Why It Doesn't Meet the Requirements
- No active notification delivery: Omitting notification channels directly violates the requirement to notify engineers via Email and Slack.
- Delayed incident response: Because no push notifications are dispatched, responders remain unaware of critical resource issues unless someone happens to actively monitor the Cloud Monitoring console.
- Ineffective documentation delivery: Although the troubleshooting information is defined in the policy, it will only be visible to users who manually open the incident details page within the Google Cloud console.
Key Characteristics and Limitations of Silent Alerts
- Restricted to the console: Incidents exist purely as records in the Cloud Monitoring web UI.
- Zero external communication: No webhooks, mobile push alerts, chat messages, or emails are generated.
- High operational risk: Unmonitored silent alerts can allow critical production outages to persist unnoticed.
This Answer Would Be Correct If
You wanted to test a brand new alerting policy in a production environment to verify that threshold conditions trigger as expected without generating noise or spamming team communication channels with false positives.
Configure Email and Slack as notification channels for the alerting policy, and add the troubleshooting steps and runbook links to the policy's documentation field.
Configure Email and Slack as notification channels for the alerting policy, and add the troubleshooting steps and runbook links to the policy's documentation field.
What Notification Channels and Policy Documentation Are
Cloud Monitoring alerting policies continuously evaluate resource metrics against specified conditions and notify engineering teams when incidents occur. An alerting policy configuration consists of the condition (defining what triggers the incident), notification channels (defining where alerts are sent), and documentation (defining the contextual guidance delivered to incident responders). Google Cloud supports diverse notification channels—such as Email, Slack, PagerDuty, and Webhooks—to match an organization's existing communication workflows. The policy documentation feature allows administrators to attach Markdown-formatted troubleshooting instructions directly to incident alerts.
How It Meets the Requirements
- Multi-channel communication: Specifying both Email and Slack notification channels ensures that when an alert triggers, Cloud Monitoring immediately broadcasts the incident notification across both communication mediums simultaneously.
- Actionable troubleshooting instructions: Populating the documentation step with runbook links and remediation steps guarantees that the notification payload received in Slack and Email contains direct, actionable guidance. Responders do not need to spend critical time searching external knowledge bases.
Alert Delivery: Policy to Email and Slack
Process Flow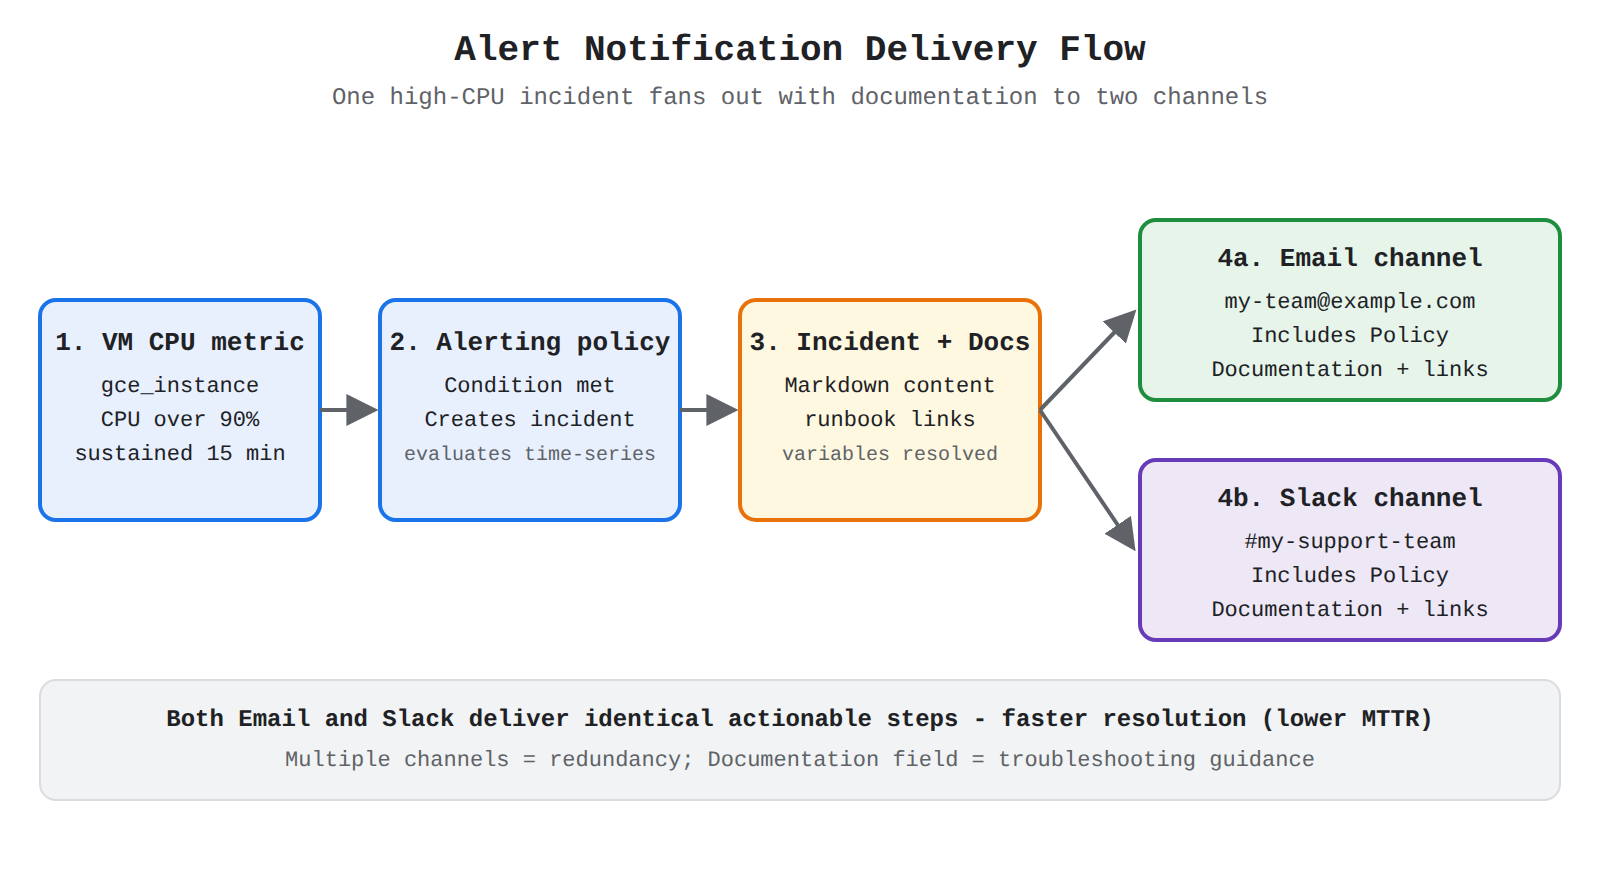
Key Advantages and Capabilities
- Markdown support: The documentation field supports standard Markdown formatting, enabling clickable hyperlinks, ordered remediation steps, bold callouts, and code blocks for quick terminal commands.
- Dynamic variables: Documentation can include incident variables (such as
${resource.labels.instance_id}or${policy.display_name}) to inject dynamic runtime context into the alert. - Reduced Mean Time to Resolution (MTTR): Immediate delivery of both the notification and step-by-step resolution instructions dramatically decreases the time needed to stabilize degraded systems.
- Centralized incident context: All responders receive identical troubleshooting procedures directly within their primary incident management tools.
Why This Is Optimal
This approach uses standard, native Cloud Monitoring capabilities without introducing unnecessary custom scripts, third-party log forwarders, or complex manual workflows. It directly fulfills both the notification routing and instructional documentation requirements within the native alerting policy creation process.
Add text widgets containing runbook steps to a Cloud Monitoring dashboard, and configure the dashboard URL as the metric aggregation alignment period.
Add text widgets containing runbook steps to a Cloud Monitoring dashboard, and configure the dashboard URL as the metric aggregation alignment period.
What Monitoring Dashboards and Alignment Periods Are
A Cloud Monitoring dashboard is an interactive visualization tool that displays metric charts, logs, and text widgets. Text widgets are static panels on a dashboard used to display explanatory notes or Markdown links. In contrast, an alignment period is a metric aggregation parameter (such as 1 minute, 5 minutes, or 1 hour) that groups raw metric data into regular time intervals for evaluation.
Why It Doesn't Meet the Requirements
- Invalid parameter assignment: An alignment period requires a duration value (such as
60sor300s). It cannot accept URLs or text strings. - No proactive alert delivery: Placing runbooks on a dashboard does not trigger or deliver notifications to Email or Slack when CPU utilization spikes.
- Poor responder experience: Rather than receiving the necessary troubleshooting instructions directly inside their alert notifications, engineers would have to manually locate and open a dashboard to find guidance.
Key Characteristics and Limitations of Dashboards and Alignment
- Passive visibility: Dashboards require active human observation; they do not replace automated alerting policies.
- Mathematical purpose of alignment: Alignment periods aggregate fluctuating time-series data using functions such as mean, maximum, or sum.
- Isolated from notification payloads: Dashboard widgets do not automatically attach their contents to outgoing notification channels.
This Answer Would Be Correct If
You needed to build a centralized operations wall display that shows real-time system performance charts alongside a persistent reference card for operators in a Network Operations Center (NOC).
Try 10 interactive questions like this one, free
Answer them yourself and get your score the moment you finish. No account needed.
Full access includes
- 2,014 practice questions across all 4 exam domains
- Every answer explained: why it is right, and why the others are not
- Scout, an AI tutor that answers your follow-up questions
- Readiness tracking by domain, so you know when to book the exam
Related free sample questions
Keep the momentum going with these hand-picked practice scenarios
FundamentalAssociate Cloud Engineer
Cloud Monitoring Alignment and Aggregation
Creating Cloud Monitoring alerts based on resource metrics
FundamentalAssociate Cloud Engineer
Cloud Monitoring Metric Threshold Duration Window
Creating Cloud Monitoring alerts based on resource metrics
FundamentalAssociate Cloud Engineer
Gemini Cloud Assist Investigation Data Sources
Using Gemini Cloud Assist for Cloud Monitoring
FundamentalAssociate Cloud Engineer
External Application Load Balancer URL Routing
Choosing and deploying load balancers
FundamentalAssociate Cloud Engineer
gcloud Service Account Creation and IAM Binding
Creating service accounts
AdvancedProfessional Cloud Network Engineer
NCC Hybrid Spokes Global Routing
Creating hybrid spokes (e.g., VPN and VLAN attachment).
Last updated