Fundamental
Prepare and test your skills

Fundamental
Prepare and test your skills
Sustained CPU Utilization Alerts With Duration Windows
Free sample question with answers and detailed explanation below. The Associate Cloud Engineer practice bank has an additional 2,014 practice questions.Try 10 free realistic questions: instant score, no credit card, and no account required.
Your team manages a production web application deployed on a fleet of Compute Engine virtual machine (VM) instances. Scheduled batch tasks frequently cause brief CPU spikes that last between 1 and 2 minutes before returning to normal levels.
You want to configure a Cloud Monitoring alerting policy that sends an incident notification only when a VM's sustained CPU utilization exceeds 85% for at least 10 consecutive minutes, thereby preventing false alarms from transient spikes.
How should you configure the alerting policy condition?
Explanations
Select the metric compute.googleapis.com/instance/cpu/utilization, set the threshold condition to "above 0.85", and configure the condition duration window to 10 minutes.
Select the metric compute.googleapis.com/instance/cpu/utilization, set the threshold condition to "above 0.85", and configure the condition duration window to 10 minutes.
What Cloud Monitoring Metric Threshold Alerting Is
Cloud Monitoring alert policies evaluate time-series metric streams against user-defined conditions. When the observed values cross a defined threshold value for a specified duration window, Cloud Monitoring opens an incident and sends notifications through designated channels.
How It Meets the Requirements
- Metric Selection: The
compute.googleapis.com/instance/cpu/utilizationmetric represents the fractional CPU utilization of Compute Engine instances, recorded as a decimal value from0.0(0%) to1.0(100%). - Threshold Value: Setting the threshold condition to "is above 0.85" correctly captures instances operating above the target 85% utilization level.
- Duration Window: Specifying a 10-minute duration ensures that every metric sample within the rolling window must violate the threshold before an alert triggers. Brief CPU spikes lasting 1 to 2 minutes fall well short of the 10-minute threshold duration and are ignored, eliminating false positive alerts.
10-Min Duration Window Filters CPU Spikes
Timeline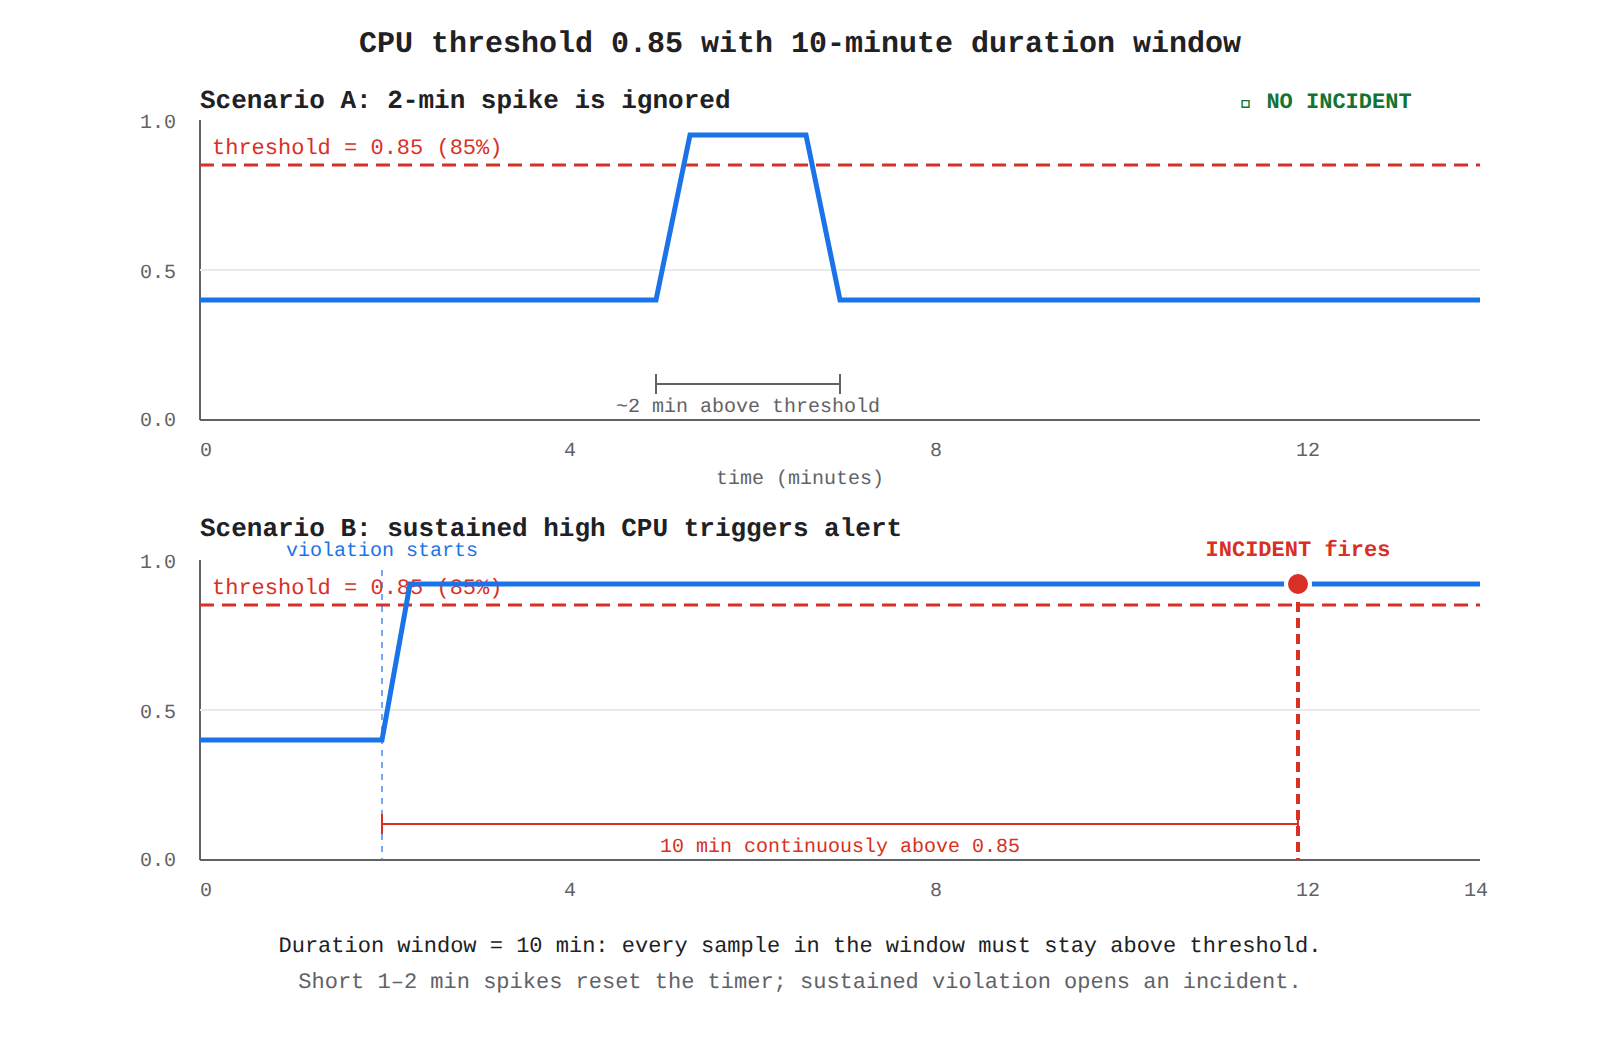
Key Advantages and Capabilities
- Noise Reduction: Duration windows filter out transient, non-critical spikes that resolve themselves quickly.
- Precise Measurement: Fractional values (
0.0to1.0) provide standard, normalized CPU metrics across varying virtual machine configurations. - Automated Incident Lifecycle: Incidents are automatically created when the threshold is violated for the full duration and automatically resolved when values return to normal levels.
- Scalable Evaluation: The condition automatically applies to all matching Compute Engine instances across the project without requiring per-instance configurations.
Why This Is Optimal
Configuring a metric threshold condition with an explicit duration window directly satisfies the operational goal of identifying sustained resource exhaustion while filtering out normal short-lived background tasks.
Select the metric compute.googleapis.com/instance/cpu/utilization, set the threshold condition to "above 85", and set the re-test window to "most recent value".
Select the metric compute.googleapis.com/instance/cpu/utilization, set the threshold condition to "above 85", and set the re-test window to "most recent value".
What This Option Does
This option attempts to evaluate the Compute Engine CPU utilization metric using an integer threshold of 85 and configures the condition to trigger immediately upon evaluating the most recent value without any time window buffer.
Why It Doesn't Meet the Requirement
- Incorrect Metric Scale: In Google Cloud Monitoring,
instance/cpu/utilizationis a normalized gauge metric with values ranging between0.0and1.0. A threshold set to85would require 8,500% utilization, which is physically impossible and means the alert would never trigger. - Missing Duration Window: Evaluating only the "most recent value" evaluates an instantaneous point in time. Even if the threshold were scaled properly, any 1-minute transient cron spike would immediately open an incident, failing the requirement to filter out short spikes.
Key Characteristics and Limitations
- Gauge Scaling: Resource utilization ratios in Cloud Monitoring are represented as floating-point decimals, not percentages.
- Immediate Triggers: Choosing "most recent value" removes the temporal filtering needed to differentiate sustained outages from momentary bursts.
- High Alert Fatigue: Without a duration window, operations teams receive repeated false alarms from normal operational variations.
This Answer Would Be Correct If
The metric measured an integer count (such as active connection count or disk queue length) and the team required immediate alerting upon a single sample crossing the threshold.
Configure a Cloud Monitoring Uptime Check with a 10-minute response timeout threshold targeting the web application endpoints.
Configure a Cloud Monitoring Uptime Check with a 10-minute response timeout threshold targeting the web application endpoints.
What Uptime Checks Are
Cloud Monitoring Uptime Checks test the external availability of public or private services by sending periodic HTTP, HTTPS, or TCP requests from multiple geographic locations.
Why It Doesn't Meet the Requirement
- Measures Endpoint Availability, Not Resource Metrics: An uptime check tests whether the web server responds with a successful status code (e.g.,
200 OK). It does not measure internal server performance metrics like CPU utilization, memory usage, or disk I/O. - Timeout Misconfiguration: The response timeout on an uptime check defines how long the probe waits for a response (maximum allowable is usually 60 seconds), not a 10-minute rolling window of sustained resource load.
Key Characteristics and Limitations
- Black-Box Monitoring: Uptime checks provide external, synthetic probing from outside the VM environment.
- Delayed Root Cause Visibility: A server could run at 95% CPU for hours while still successfully answering lightweight health check pings, leaving high resource strain completely unnoticed until total failure occurs.
- External Probers: Probes originate from distributed Google worker locations rather than internal hypervisor instrumentation.
This Answer Would Be Correct If
The objective was to verify that the public web server endpoint is reachable over the internet and responding within acceptable latency limits.
Create a logs-based alert policy that queries Cloud Logging for resource.type="gce_instance" with severity WARNING across a 10-minute aggregation period.
Create a logs-based alert policy that queries Cloud Logging for resource.type="gce_instance" with severity WARNING across a 10-minute aggregation period.
What Logs-Based Alerting Is
Logs-based alerting parses incoming log entries in Cloud Logging to identify specific error messages, status codes, or audit events, triggering notifications when matching log counts exceed a defined rate.
Why It Doesn't Meet the Requirement
- Metric vs. Log Data: Standard CPU utilization is continuously gathered as a numerical time-series metric by the hypervisor and Monitoring agent; high CPU utilization does not inherently emit a
WARNINGlog entry in syslog or Cloud Logging. - Incomplete Signal Coverage: Relying on log severity entries means CPU saturation will go completely undetected unless an application specifically catches high load and writes explicit warning log statements.
Key Characteristics and Limitations
- Event-Driven: Logs-based alerts are suited for discrete events (e.g., authentication failures, HTTP 500 status codes) rather than continuous continuous numerical resource metrics.
- Log Volume Dependency: Alerting depends on continuous log ingestion and correct application-level logging behavior.
- Cost and Processing: Parsing high volumes of log text is less direct and computationally heavier than evaluating native time-series metrics.
This Answer Would Be Correct If
The requirement was to alert when specific error messages, kernel panics, or application warning events appeared in instance log files with a sustained frequency.
Try 10 interactive questions like this one, free
Answer them yourself and get your score the moment you finish. No account needed.
Full access includes
- 2,014 practice questions across all 4 exam domains
- Every answer explained: why it is right, and why the others are not
- Scout, an AI tutor that answers your follow-up questions
- Readiness tracking by domain, so you know when to book the exam
Related free sample questions
Keep the momentum going with these hand-picked practice scenarios
FundamentalAssociate Cloud Engineer
Cloud Monitoring Alignment and Aggregation
Creating Cloud Monitoring alerts based on resource metrics
FundamentalAssociate Cloud Engineer
Cloud Monitoring Alerting Policy Documentation
Creating Cloud Monitoring alerts based on resource metrics
FundamentalAssociate Cloud Engineer
gcloud Container Clusters Get-Credentials
Installing and configuring the command-line interface (CLI) for Kubernetes (kubectl)
FundamentalAssociate Cloud Engineer
Config Connector Drift Reconciliation
Infrastructure as code tooling (e.g., Fabric FAST, Config Connector, Terraform, Helm)
FundamentalAssociate Cloud Engineer
External Application Load Balancer URL Routing
Choosing and deploying load balancers
IntermediateProfessional Cloud Architect
BigQuery Table Clones for Test Data Isolation
Testing frameworks (load/unit/integration)
Last updated