Fundamental
Prepare and test your skills

Fundamental
Prepare and test your skills
Sustained Fleet CPU Alerts Using Mean Aggregation
Free sample question with answers and detailed explanation below. The Associate Cloud Engineer practice bank has an additional 2,014 practice questions.Try 10 free realistic questions: instant score, no credit card, and no account required.
Your company runs a web application distributed across multiple Compute Engine instances in a managed instance group. During routine background tasks, individual virtual machines (VMs) experience brief, transient CPU spikes that cause alerting policies to trigger false positive notifications. You need to configure a Cloud Monitoring alert policy that evaluates the sustained workload of the entire fleet and triggers only when the collective CPU utilization across all VMs exceeds an 80% threshold over a 5-minute window.
Which alignment and aggregation method should you configure for the time-series metric?
Explanations
Configure a 1-minute alignment period using the Rate of change aligner, and combine the time series across instances using the Max reducer
Configure a 1-minute alignment period using the Rate of change aligner, and combine the time series across instances using the Max reducer
What Rate of Change Alignment and Max Reduction Does
The Rate of change aligner measures how rapidly a metric value changes per unit of time (derivative) rather than reporting the current magnitude of the metric. Combining this with a Max cross-series reducer tracks the single fastest rate of increase observed across any node in the fleet.
Why It Doesn't Meet the Requirement
- Measures Velocity, Not Utilization: Rate of change identifies how quickly CPU is climbing or falling, not whether the current utilization is above 80%.
- Fails on Sustained High Load: An instance running steadily at 95% CPU has a rate of change near zero, meaning this policy would fail to alert during ongoing, critical overload.
- High Sensitivity to Spikes: Rapid jumps in workload generate massive instantaneous rate-of-change spikes, increasing false alarms.
Key Characteristics and Limitations
- Differential Metric Evaluation: Reflects slope and acceleration rather than steady-state magnitude.
- Extreme Outlier Amplification: Using Max reduction highlights the single most volatile instance rather than the fleet average.
- Incompatible with Static Limits: Static capacity limits (such as 80% CPU) cannot be evaluated accurately using rate-of-change outputs.
This Answer Would Be Correct If
This method would be appropriate for Early Anomaly and Surge Detection, such as detecting a sudden flash crowd or runaway loop by alerting when CPU usage surges upward at an abnormal rate (e.g., rising faster than +30% CPU per minute).
Configure a 5-minute rolling alignment period using the Mean (Average) aligner, and combine the time series across instances using the Mean (Average) reducer
Configure a 5-minute rolling alignment period using the Mean (Average) aligner, and combine the time series across instances using the Mean (Average) reducer
What Mean Alignment and Cross-Series Mean Aggregation Is
In Google Cloud Monitoring, processing time-series data involves two essential stages: alignment (regularizing and smoothing points within an individual time series over an alignment period) and cross-series reduction/aggregation (combining multiple time series across distributed resources into a single meaningful stream). Using the Mean (Average) function for both stages provides a smoothed, representative indicator of fleet-wide utilization.
Two-Stage Mean Smoothing Pipeline
Process Flow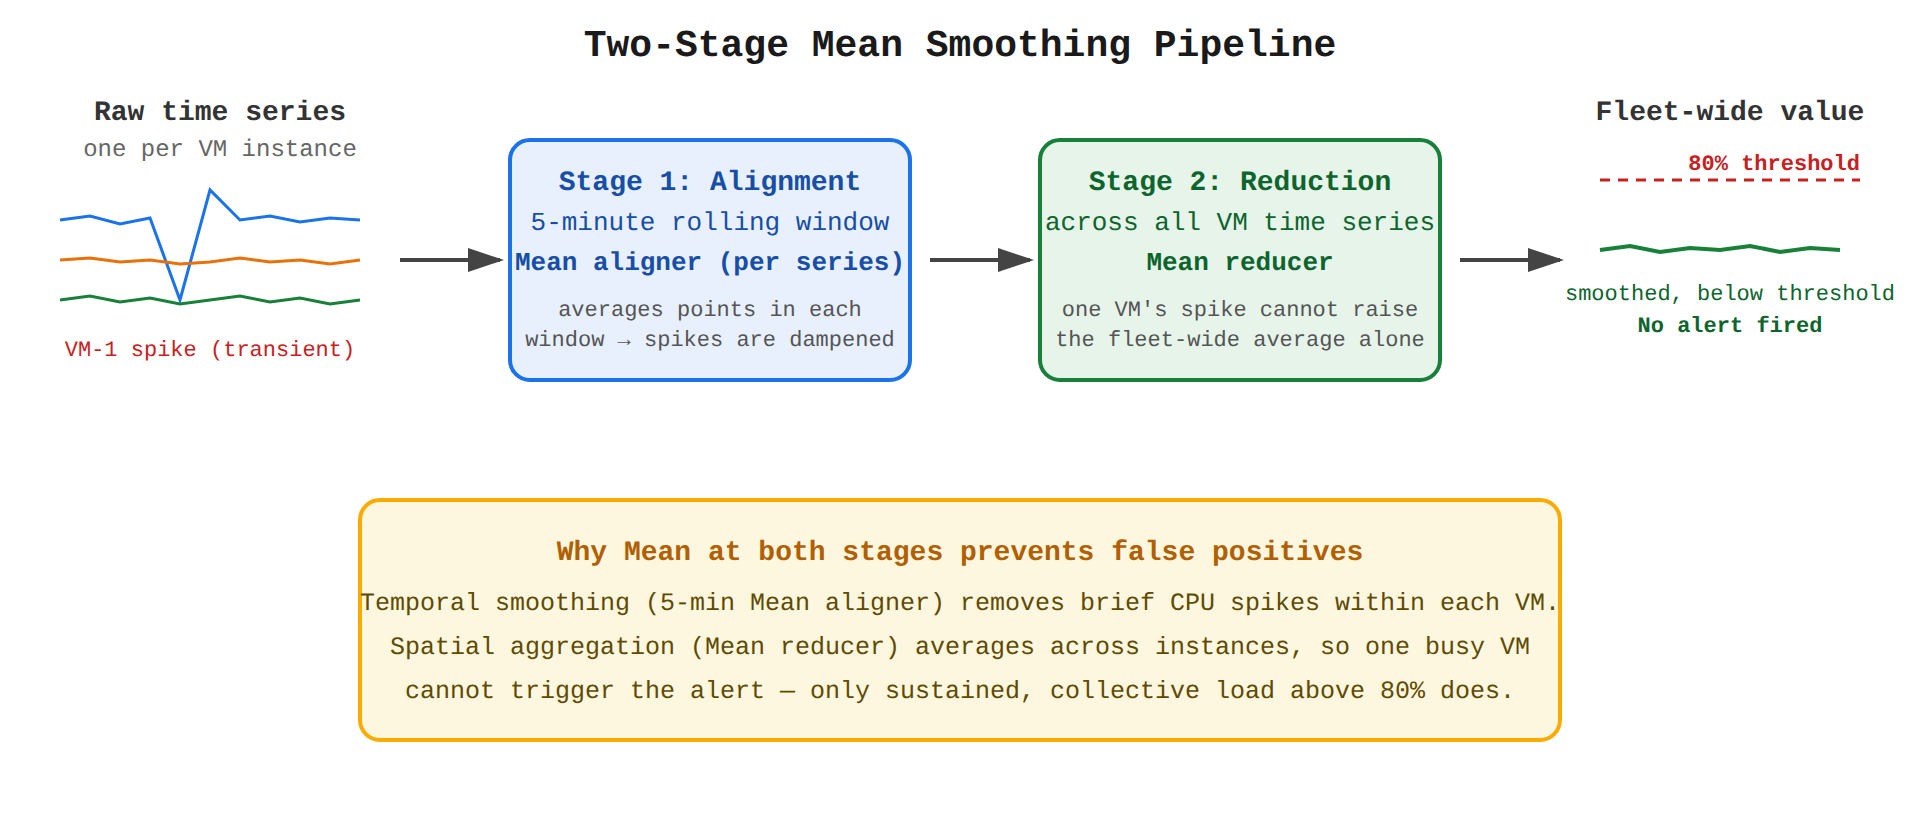
How It Meets the Requirements
- Eliminating Transient Spikes: Applying a 5-minute alignment period with a Mean aligner calculates the average utilization over 5 minutes for each individual VM, effectively dampening brief, temporary spikes that return to baseline quickly.
- Evaluating Fleet-Wide Utilization: Grouping and reducing multiple VM time series using the Mean (Average) reducer summarizes individual VM metrics into a single fleet-wide average. This ensures that a localized spike on a single VM does not raise a fleet alert unless the entire group's collective workload exceeds the 80% threshold.
- Minimizing False Positives: By smoothing both over time (temporal alignment) and across resources (spatial aggregation), alert evaluations rely on persistent, systemic workload trends rather than transient anomalies.
Key Advantages and Capabilities
- Data Smoothing: Eliminates high-frequency noise from short-lived background jobs like garbage collection.
- Fleet Normalization: Provides an accurate picture of total capacity consumption across autoscaling groups.
- Resource-Agnostic Thresholds: Allows teams to set consistent percentage-based thresholds regardless of instance count changes.
- Standardized Intervals: Transforms irregular metric collection intervals into uniform, predictable evaluation windows.
Why This Is Optimal
Alternative reducers such as Max or Sum either preserve single-node spikes or scale upward with instance counts, making them unsuitable for percentage-based fleet thresholding. Using Mean at both the alignment and reduction stages directly matches the goal of tracking sustained, collective CPU performance.
Configure a 5-minute alignment period using the Sum aligner, and combine the time series across instances using the Sum reducer
Configure a 5-minute alignment period using the Sum aligner, and combine the time series across instances using the Sum reducer
What Sum Alignment and Sum Aggregation Does
The Sum aggregation function adds all values together within the alignment window and across all time series streams. For gauge metrics such as CPU utilization percentages, summing combines percentage values across all running VMs into an aggregate sum.
Why It Doesn't Meet the Requirement
- Distorts Percentage Metrics: CPU utilization is an intensive ratio metric. Summing percentages across 10 VMs at 20% utilization each results in a combined metric of 200%, which cannot be evaluated against an 80% ceiling.
- Dynamic Fleet Incompatibility: In autoscaling environments, the sum of CPU utilization increases simply by adding more instances, rendering static threshold alerting impossible.
Key Characteristics and Limitations
- Additive Aggregation: Best suited for cumulative or delta counters (e.g., total network bytes, request counts).
- Misalignment with Ratios: Produces nonsensical values when applied to fractional or percentage-based measurements.
- Scales with Fleet Size: Threshold breaches become a function of instance count rather than actual workload severity.
This Answer Would Be Correct If
This configuration would be correct if you were monitoring Total Request Count or Aggregate Ingress Bandwidth across the fleet, where summing discrete numerical events over 5 minutes gives the total volume processed by all servers combined.
Configure a 1-minute alignment period using the Max aligner, and set cross-series aggregation to None
Configure a 1-minute alignment period using the Max aligner, and set cross-series aggregation to None
What Max Alignment Without Cross-Series Aggregation Does
The Max aligner captures the highest single metric sample within each alignment period for every individual time series. Leaving cross-series aggregation set to None preserves each VM's time series as an independent stream evaluated separately against the alert threshold.
Why It Doesn't Meet the Requirement
- Exacerbates False Positives: Setting the aligner to Max over a short 1-minute window isolates peak values rather than smoothing them, ensuring that even very brief spikes trigger an alert.
- Evaluates Nodes Independently: Setting cross-series aggregation to None forces the alerting policy to alert whenever any single VM violates the threshold, directly conflicting with the goal of evaluating the collective fleet.
Key Characteristics and Limitations
- Peak Sensitivity: Retains extreme outlier samples rather than true operational averages.
- High Alert Volume: Multiple independent time series evaluated simultaneously increase the statistical likelihood of false alarms.
- No Fleet Summarization: Fails to provide holistic visibility into overall application capacity.
This Answer Would Be Correct If
This configuration would be appropriate if your objective were a strict Single-Node Failure Detection Policy, where exceeding 80% CPU on any individual instance for even a single minute signals a critical process hang that requires immediate automated remediation.
Try 10 interactive questions like this one, free
Answer them yourself and get your score the moment you finish. No account needed.
Full access includes
- 2,014 practice questions across all 4 exam domains
- Every answer explained: why it is right, and why the others are not
- Scout, an AI tutor that answers your follow-up questions
- Readiness tracking by domain, so you know when to book the exam
Related free sample questions
Keep the momentum going with these hand-picked practice scenarios
FundamentalAssociate Cloud Engineer
Cloud Monitoring Alerting Policy Documentation
Creating Cloud Monitoring alerts based on resource metrics
FundamentalAssociate Cloud Engineer
Cloud Monitoring Metric Threshold Duration Window
Creating Cloud Monitoring alerts based on resource metrics
FundamentalAssociate Cloud Engineer
OS Login IAM SSH Access
Remotely connecting to a Compute Engine instance
FundamentalAssociate Cloud Engineer
Memorystore High Availability SLA Requirements
Choosing and deploying data products (e.g., Cloud SQL, BigQuery, Firestore, Spanner, Bigtable, AlloyDB, Dataflow, Pub/Sub, Google Cloud Managed Service for Apache Kafka, Memorystore)
FundamentalAssociate Cloud Engineer
Regional Persistent Disk Synchronous Replication
Choosing the appropriate storage for Compute Engine (e.g., zonal Persistent Disk, regional Persistent Disk, Google Cloud Hyperdisk)
AdvancedProfessional Cloud DevOps Engineer
Kubernetes Ephemeral Debug Containers
Collecting metrics (e.g., from applications, platforms, networking, Cloud Service Mesh, Google Cloud Managed Service for Prometheus, hybrid/multi-cloud environments)
Last updated