Fundamental
Prepare and test your skills

Fundamental
Prepare and test your skills
Controlling Cloud Costs with Budgets and Quotas
Discuss how Google Cloud supports an organization's financial governance and ability to control their cloud costs.
Financial governance in Google Cloud is the system of budgets, quotas, discounts, and reporting that keeps cloud spending visible, assigned to owners, and within limits. Budgets (opens in a new tab) track planned versus actual spending, quotas block excess resource creation, and billing reports connect every charge to a project, team, or business purpose. Together these controls let product owners, developers, administrators, and financial analysts make cost-effective decisions before costs grow.
How Budgets and Quotas Create Financial Guardrails
Budgets and quotas are complementary guardrails where budgets warn about money and quotas block excess consumption. A budget defines how much a team or project should spend after discounts and shared costs, while cost allocation assigns a portion of the total budget to each team so each team owns its spending. Teams need projected costs at design time, real-time usage costs for monitoring, and costs mapped to business metrics such as key performance indicators (KPIs) to validate budgets and choose cost-effective designs.
Budget Guardrail Loop: Monitor, Alert, Act
Process Flow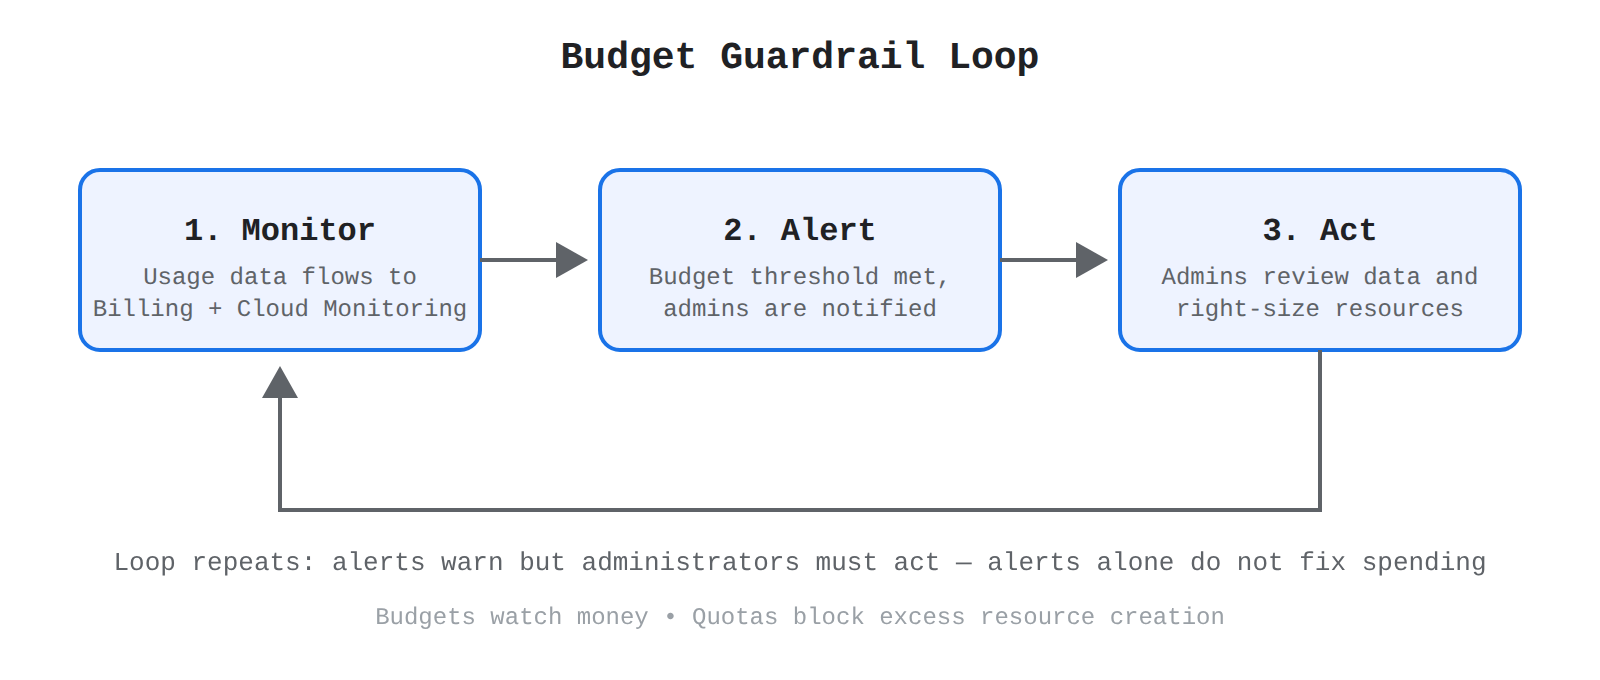
A three-step process flow showing the budget guardrail loop: resource usage data flows to Cloud Monitoring and Billing, an alert fires when a spending threshold is met, and administrators right-size resources before the loop repeats. Animated pulses move along the arrows in order to show the direction of the loop.
The guardrail works as an ordered loop. First, spending and utilization data flows from running resources to the Billing dashboard and Cloud Monitoring. Then the system sends an alert to administrators when a predefined threshold is met. Finally, administrators review the data and right-size resources to balance cost against performance and user experience. Alerts alone do not fix spending because action by administrators is still required.
| Control | Primary purpose | What happens at the threshold or limit |
|---|---|---|
| Budgets | Track planned versus actual spending for a team or project | Stakeholders receive an alert and then decide how to adjust allocation |
| Quotas | Limit how much can be provisioned or consumed in a project | Additional resource creation is blocked, which prevents further cost from that consumption |
Exam tip: Budgets notify stakeholders when spending thresholds are reached, while quotas prevent unexpected costs by blocking additional resource consumption.
How Discounts and Rightsizing Lower the Effective Rate
Cost optimization in Google Cloud means matching resources to real demand and paying the lowest rate for what is used. Committed Use Discounts (CUDs) give lower prices in exchange for committing to a minimum quantity or spend for one year or three years, with resource-based CUDs for Compute Engine in a specific region and spend-based CUDs for spend on a product at the billing account level. Sustained Use Discounts (SUDs) are automatic credits for continuous Compute Engine and Google Kubernetes Engine (GKE) use during a billing cycle with no commitment required.
Discount Options Decision Guide
Decision TreeA decision tree that branches on workload predictability, fault tolerance, and discount commitment to recommend Committed Use Discounts, Sustained Use Discounts, or Spot VMs.
Rightsizing fixes waste that discounts alone cannot fix because data flows from the monitored workload to Cloud Monitoring to Recommender and then to the administrator as a recommendation. Recommender targets specific waste:
- Idle VM recommendations: identify unused Compute Engine instances that can be decommissioned.
- Idle resources recommendations: identify unneeded attached resources that still generate charges.
- Machine type recommendations: suggest a cheaper instance type when a VM is consistently over-provisioned.
| Option | How discount is earned | Choose when |
|---|---|---|
| Committed Use Discounts (CUDs) | Commit to minimum quantity or spend for one year or three years | Usage is predictable and steady over a long term |
| Sustained Use Discounts (SUDs) | Run Compute Engine or GKE resources continuously past monthly thresholds | Usage is steady through the month but no long-term commitment is wanted |
| Spot VMs | Use unused VM capacity at more than 80% lower cost than regular VMs | Workloads are fault-tolerant and flexible, such as batch jobs that can tolerate preemption |
How Hierarchy, Labels, and Billing Reports Create Accountability
Visibility and accountability come from the resource hierarchy, labels and tags, and Cloud Billing reports working together. Costs flow upward from individual resources to the project that contains them, then to folders and the Organization, while a Cloud Billing account tracks charges for all linked projects for payment. Ownership that controls Identity and Access Management (IAM) inheritance is separate from payment linkage that defines which billing account pays.
Labels such as team=banking_appdev and tags are key-value pairs forwarded to billing so reports can break down costs by team, product, region, or environment. A strong metadata strategy keeps this accurate through validity that maps labels to business needs, automation with tools like Terraform to avoid manual errors, and simplicity that avoids confusing rules. Cloud Billing reports can then be filtered and grouped by project, service, SKU, and label, with the Cost Table for invoice reconciliation and Cost Breakdown for costs after savings, plus BigQuery export for custom dashboards.
Discuss how using cloud financial governance best practices provides predictability and control for cloud resources.
Predictable cloud spending in Google Cloud comes from combining financial targets, consumption limits, and optimization rules into one control system. Cloud Billing Budgets (opens in a new tab) set spending targets and send alerts, quotas limit how many resources can be created, and organization policies control where and how resources run. Standardized calculation after discounts, allocation of budget shares to teams, and continuous monitoring keep every role informed and inside clear boundaries.
Budgets, Spend Caps, Quotas, and Policies for Predictable Spending
Budgets for predictable spending rely on consistent cost calculation, team-level allocation, and alerts that trigger human action. The Billing dashboard shows real-time spend and regular snapshots such as weekly progression for forecasting, while custom metrics in Cloud Monitoring notify administrators when thresholds are met. This flow moves from resource usage to cost data to alert to human action.
Spend cap budgets are a stricter type of budget that automatically blocks new usage when gross, estimated costs exceed 100% of the budget amount in a single project. Alert emails are sent when spend exceeds 50% and 80% of the cap, and while the cap is enforced, in-flight requests run to completion but no new on-demand or commitment-covered usage can start. Spend caps do not pause persistent resources such as compute and storage, and normal service returns only after manual intervention in the billing console to lift the cap. Spend caps apply only to specific services in one project:
- Gemini API in the specified project is blocked from new usage when its cap is reached.
- Gemini Enterprise Agent Platform in the specified project is blocked from new usage when its cap is reached.
- Cloud Run in the specified project is blocked from new usage when its cap is reached.
- Cloud Run functions in the specified project are blocked from new usage when their cap is reached.
Exam tip: A spend cap budget is limited to a single project and a single eligible service with a monthly period starting on the first day of the month, and its calculations use gross costs without savings and credits.
Rightsizing, Autoscaling, and Environment Choices for Optimization
Resource optimization balances cost and performance by adjusting allocation to match actual demand. Right-sizing means continuously monitoring utilization and changing the size of an existing resource, while autoscaling means dynamically adding or removing resources as demand changes. Cloud Monitoring provides utilization metrics, Recommender suggests better allocation, and custom metrics and alerts trigger timely resizing.
Google Cloud offers several autoscaling options tied to demand signals:
- Compute Engine managed instance groups (MIGs) scale groups of VMs as one entity within minimum and maximum limits, often on CPU utilization.
- Google Kubernetes Engine (GKE) Cluster Autoscaler adds or removes nodes based on Pod resource demands.
- Cloud Run scales to zero instances by default when there is no traffic, so no instance costs accrue when idle.
Workload and environment choice reinforces the same control. Production needs high availability and robust resources, development and testing prioritize cost efficiency with burstable and ephemeral infrastructure, and staging and QA use tailored allocation. Mission-critical workloads use premium resources such as Spanner, non-critical workloads use basic and ephemeral resources such as Spot VMs, and event-driven workloads use serverless services such as Cloud Run. Resource location constraints then enforce region choice, which matters because pricing varies by region and data residency rules limit where data can be stored.
Dashboards, Labels, and Tailored Reports for Cost Visibility
Cost visibility turns raw billing data into trends, forecasts, and early warnings for each audience. Labels assign each resource to a project, department, cost center, or environment, and automation with Terraform plus the open-source Cost Attribution solution keeps labeling complete for chargeback. Clean labels allow reports and dashboards to filter by the right dimension and reveal high usage or savings opportunities.
Data flows from Cloud Billing to visualization on two paths: built-in views use the data directly, and custom views first export billing data to BigQuery for analysis and then connect Data Studio to BigQuery for interactive reports. Access on both paths is controlled by role-based access control (RBAC). Common reporting practices include periodic cost reports by email or dashboard, automated email or chat notifications for anomalies and thresholds, built-in billing dashboards plus FinOps hub recommendations, custom BigQuery and Data Studio dashboards, and multicloud reports that centralize costs from multiple providers in BigQuery.
Core cost-management concepts in Google Cloud explain who pays, who owns costs, and how spending is kept within plan. The resource hierarchy (opens in a new tab) organizes resources, Cloud Billing accounts define who pays, labels assign costs to owners, and budgets, alerts, and quotas provide warnings and limits. The governance process follows a fixed order: first monitor costs for visibility, then control provisioning to stop uncontrolled growth, and only then reduce rates with discounts.
Resource Hierarchy, Billing Accounts, and Governance Controls
The resource hierarchy maps company structure to cloud resources for visibility and control. A domain relates to the organization resource for the whole company, folders below it can separate departments or production from development, and projects below folders contain service resources such as virtual machines, storage, and networking. Every project must be linked to a Cloud Billing account to function, and one billing account can pay for many projects.
A Cloud Billing account tracks all costs and links to a Google Payments profile that holds payment methods and tax information. There are two account types: self-serve online accounts charge automatically to the payment method, while invoiced offline accounts receive a monthly invoice and typically require eligibility. Access is separated by IAM roles where the creator becomes Billing Account Administrator with full control, Billing Account Viewer can view costs, and Billing Account User can link projects. Cost allocation then uses labels and tags such as team=banking_appdev that flow into billing exports, and chargeback recovers costs from internal customers to promote fiscal discipline.
| Control | What it does | Effect on spending |
|---|---|---|
| Budget | Tracks planned versus actual spend for a billing account, projects, services, or labels | Warns; does not automatically cap spend |
| Budget alert | Sends notifications at thresholds such as 50%, 90%, and 100% | Warns stakeholders so they can act |
| Quota | Limits how much of a shared resource can be used, up to a cap | Blocks resource use beyond the limit |
| Spend cap budget | Pauses eligible services when enforced | Stops charges for the service in the project until manually lifted |
Exam tip: A budget warns you about spending, a quota limits resource usage, and a spend cap budget pauses eligible services until you manually lift it.
Capital Versus Operating Expenses in the Cloud
Capital expenditure (CapEx) and operating expenditure (OpEx) are two different ways to account for IT spending. CapEx is a large upfront purchase of a long-lived asset the organization owns, such as servers for a data center, with costs spread over time through depreciation. OpEx is ongoing pay-as-you-go spending for services consumed as needed, such as Google Cloud charges for compute actually used, recorded as incurred.
Consumption-based pricing increases agility but requires active governance. Teams can provision through the console, SDK, APIs, and Terraform without procurement cycles, and autoscaling with Compute Engine MIGs and Cloud Run ties capacity to demand and avoids overprovisioning. The tradeoff is predictability because variable usage rises and falls with consumption instead of following a fixed depreciation schedule.
| Dimension | Capital expenditure (CapEx) | Operating expenditure (OpEx) |
|---|---|---|
| What is paid for | A long-lived asset the organization owns | Services consumed as they are used |
| When payment occurs | Upfront, before the workload runs | Continuously, as usage happens |
| Capacity planning | Must estimate peak demand in advance | Capacity can follow actual demand |
| Cost behavior | Fixed and depreciated over time | Variable and tied to consumption |
Committed, Sustained, and Spot Pricing Options
Pricing models and discounts in Google Cloud lower the billing rate based on commitment and flexibility. Committed use discounts (CUDs) exchange a one-year or three-year commitment for lower prices and suit stable workloads, with enterprise discounts for total spend commitments, resource-based CUDs for Compute Engine quantity in a region, and spend-based CUDs for spend on a product at the billing account level. Resource-based CUDs can be shared across projects under most billing accounts, CUD auto-renewal avoids gaps when commitments expire, and CUDs can stack on enterprise discounts.
Sustained use discounts are automatic credits for continuous Compute Engine and GKE use beyond duration thresholds with no commitment. Spot VMs provide unused capacity at more than 80% lower cost than regular VMs but Compute Engine can preemptively stop or delete them to reclaim capacity. Anomaly detection, programmatic notifications, and FinOps hub help track whether the chosen strategy still fits after prices or features change.
| Option | How savings are earned | Choose when |
|---|---|---|
| Committed use discounts (CUDs) | Commit to minimum quantity or spend for one to three years | Usage is predictable and steady over a long period |
| Sustained use discounts | Run Compute Engine or GKE resources continuously beyond duration thresholds with no commitment | Usage is consistent during the billing cycle but not pre-committed |
| Spot VMs | Use unused VM capacity at more than 80% lower cost with risk of preemption | Workload is fault-tolerant, flexible, and can tolerate being stopped |
Continue with this study guide: Define important cloud cost-management terms and concepts.
The Google Cloud resource hierarchy is a parent-child tree that lets administrators apply access, rules, and cost tracking from central points. Resource Manager (opens in a new tab) provides the hierarchy with an Organization at the top, optional folders in the middle, and projects at the base that hold service resources. Because policies flow downward, one setting at a high level can control many descendants without configuring each resource separately.
Organization, Folder, and Project Levels for Grouping
Hierarchy levels define where governance gets broader and where billing stays specific. The organization resource is the root above all folders and projects and provides central visibility, ownership continuity, and company-wide inheritance. Folders sit between the organization and projects, can nest inside other folders, and group control for a department or environment with delegated administration and grouped cost reporting. The project is the base container directly above service resources and provides per-project billing, API enablement, and direct assignment of collaborators.
The organization requires a Google Workspace or Cloud Identity account, and managed users must create projects inside an organization so projects belong to the company rather than the creator. Folders require an organization resource and can model departments, teams, legal entities, or production, staging, development, and testing environments. Projects hold resources such as virtual machines and storage buckets, and every service resource belongs to exactly one project identified by project ID or project number. Projects carry a unique project ID, a read-only project number, a mutable display name, labels for filtering, and a lifecycle state such as ACTIVE or DELETE_REQUESTED.
How IAM and Organization Policies Inherit Downward
Policy inheritance is the rule that policies attached to a parent automatically apply to all descendants along one clear path. Identity and Access Management (IAM) defines who can act by binding principals such as users, service accounts, and groups to roles, while the Organization Policy Service defines what configurations are allowed, such as permitted locations or blocking public IP addresses. Resource Manager provides the structure that both systems rely on to determine where policies attach and how they flow.
IAM allow policies combine additively, so the effective policy is the union of the policy set directly on a resource plus inherited policies. For example, granting Network Admin at the organization lets a networking team manage all networks, and granting Folder Admin on a folder covers all current and future projects in that folder. Deny policies are evaluated before allow policies and can override an allow at the organization, folder, or project level. Organization policies are also inherited but can be superseded by a lower-level policy, which allows company-wide guidelines with exceptions. Folder design has fixed limits: folders can nest up to 10 levels deep, a parent can have at most 300 direct child folders, and display names must be unique within the same level.
Exam tip: IAM controls who can act on a resource, while Organization Policy controls what configuration is allowed for a resource.
Central Visibility With Delegated Folder Administration
Centralized control and delegated administration balance global oversight with local autonomy. Central administrators use the Manage resources page to view the full hierarchy, expand the Organization to see child folders, and filter by name, ID, or label. IAM allows set at the organization grant access to everything below, Organization Policy constraints restrict operations everywhere below, and roles such as Organization Viewer support audit across the company.
Delegation happens by granting folder roles to specific people. Folder Admin has administrative control over that folder, Folder Creator can create child folders, and Folder Viewer can list folders and view details. An existing administrator with Folder IAM Administrator or Folder Admin at the parent must grant the role, and a department lead can then manage members and projects inside their folder without changing controls set above. Billing reports support the same model by aggregating project-level charges to folder totals, while tags and folder-level log sinks extend categorization and audit.
| Hierarchy level | Scope of control | Typical administrative use |
|---|---|---|
| Organization resource | Entire company, including all folders and projects | Enforce global policies, grant company-wide roles, maintain central visibility |
| Folder | One department or team, including its child folders and projects | Delegate administration to team leads while inheriting global policies |
| Project | One workload, including its resources | Manage day-to-day access and services for a specific application |
Describe the benefit of controlling cloud consumption using resource quota policies and budget threshold rules.
Controlling consumption with quotas and budget rules prevents bill shock and keeps shared capacity available. Resource quota policies (opens in a new tab) cap how much can be provisioned or consumed, while budget threshold rules track actual or forecasted spending and send alerts before overruns grow. Quotas enforce capacity, budgets watch money, and regular review keeps both aligned as needs change.
Why Quotas and Budget Rules Work Better Together
Quota levels and budget scopes create a multi-layered defense against unexpected cost. Project-level quotas set overall boundaries for every service in a project, service-specific quotas cap one service such as Compute Engine or BigQuery, and resource type-specific quotas restrict one type such as Compute Engine VMs, Cloud Storage buckets, Cloud Run instances, or GKE nodes. Quota alerts notify owners when use reaches a percentage of the maximum so teams act early.
Budget rules define allowed spend for each project, workload, and environment, including infrastructure, licenses, personnel, and growth, and Cloud Billing budgets and alerts give real-time insight into overruns. Labels, tags, project hierarchy, and organization policies that limit locations and products help assign costs and steer teams to cost-effective options.
| Control | What it does | Scope | Alert or action |
|---|---|---|---|
| Resource quota policies | Limit how much of a resource can be provisioned or used | Project, service, or resource type | Quota alerts notify when usage reaches a percentage of the maximum value |
| Budget threshold rules | Track actual spending against defined spending limits | Project, service, resource, team, or workload | Cloud Billing budgets and alerts notify stakeholders of potential overruns |
Exam tip: Quotas limit resource consumption or provisioned capacity, while budgets track spending and trigger alerts.
Actual Versus Forecasted Budget Thresholds and Notifications
Budget threshold rules compare spend against a percentage of the budget and send a Cloud Billing alert only when that percentage is reached. Actual rules fire when cumulative costs accrued in the period pass the threshold, while forecasted rules fire when the estimated cost for the full period is expected to pass the threshold. Forecasted alerts work only for recurring calendar budgets such as monthly, quarterly, or yearly budgets, while custom-range budgets rely on actual spend only.
| Spend basis | What triggers the alert | Example on a $100 budget |
|---|---|---|
| Actual spend | Cumulative cost accrued during the budget period exceeds the threshold amount | A 50% rule sends an alert after $50 has been spent |
| Forecasted spend | Estimated cost for the full calendar budget period exceeds the threshold amount | A 110% rule sends an alert when spend is forecasted to exceed $110 |
New budgets start with 50%, 90%, and 100% of the budget amount against actual spend, and owners can change percentages or amounts, switch spend basis, or add and delete thresholds. Email delivery depends on threshold rules: alerts go to Billing Account Administrators and Users, to Project Owners only when scoped to a single project, or to Cloud Monitoring notification channels for team lists. Removing all threshold rules disables email alerts. Pub/Sub programmatic notifications publish budget status multiple times per day for automation such as Slack forwarding or disabling billing, but the message includes alertThresholdExceeded and forecastThresholdExceeded only when at least one threshold rule and one email option are enabled. An alerts-only budget never stops usage, services keep running after thresholds, cost data can lag by a day or more, and teams should set budget amounts below available funds to allow for late usage, taxes, and adjustments.
How Cloud Quotas Limit Allocation, Rate, and Concurrency
The Cloud Quotas system counts consumption against a limit and blocks requests that would exceed it. Consumption flows from applications and IP addresses in a project to the quota counter, and within a project quotas are shared so heavy use by one workload reduces availability for others. Quotas also protect shared services from spikes and help free-tier users stay within trial limits.
Google Cloud limits consumption in three ways:
- Allocation quotas: restrict how much of a resource is allocated to a project, such as number of Compute Engine VMs.
- Rate quotas: restrict how fast a resource can be consumed, such as API requests per minute or per day.
- Concurrent quotas: restrict how many long-running operations run at once, such as Compute Engine
insertoperations that can run up to one hour.
Quotas apply at project, folder, and organization levels, where child resources contribute to the shared limit, plus some user-level quotas such as how many projects a user can create. Global quotas are shared across all regions and zones, regional quotas are isolated to one region, and zonal quotas are isolated to one zone, with some resources having both regional and zonal limits where zone use also reduces the regional total. When quota runs out, the task is blocked: a gcloud command returns a quota exceeded error with exit code 1 and an API request returns HTTP 413 Request Entity Too Large. Allocation quota returns when unused resources are deleted, rate quota resets when the period ends with per-day quotas resetting at midnight Pacific Time, and sustained growth may need a quota adjustment, though quotas do not guarantee physical capacity.
| Option | Can it be changed | Example |
|---|---|---|
| Quota | Yes, often by requesting an adjustment | Number of VMs per project or API calls per minute |
| System limit | No, fixed value | Maximum file size or database schema limitation |
Cloud Billing Reports (opens in a new tab) is the console page that visualizes usage costs for a Cloud Billing account and all linked projects. The page monitors current spending, compares costs over time, identifies which projects or services cost the most, and forecasts future costs. It answers questions such as which project cost the most last month, how daily service costs compare, what future costs look like, and how much is spent by region or label.
Report Access, Charts, and Time Ranges for Cost Analysis
Access to billing reports is controlled by IAM so visibility matches responsibility. A user with full account permissions sees all linked projects, while a user with project-scoped permissions sees only authorized projects and, with single-project access, does not see invoice-level charges such as taxes.
| Access scope | Required permissions | What the user can view |
|---|---|---|
| Full Cloud Billing account | billing.accounts.get, billing.accounts.getIamPolicy, billing.accounts.getSpendingInformation on the Cloud Billing account | Costs for all projects linked to the Cloud Billing account |
| Project-scoped | billing.resourceCosts.get and resourcemanager.projects.get on each project, plus project-scoped billing permissions on the linked account | Aggregated costs for authorized projects, or one project at a time; no invoice-level charges for single-project access |
The main Reports page shows a stacked bar or line chart of costs over time with forecasts in light grey, plus a table where rows expand to show daily costs per service. The Cost breakdown report is a waterfall chart that moves left to right from base usage to credits to subtotal to invoice charges to total, with Charges in orange, Credits in green, and Subtotal and Total in blue. A budget target can be plotted as a red line against actual costs.
| Time range type | Data returned | Availability | Forecast support | Invoice-level charges |
|---|---|---|---|---|
| Charge period (formerly Usage date) | Actual usage and cost incurred during the selected dates | Back to January 2017 | Yes, if the range ends in the future | Not included |
| Billing period (formerly Invoice month) | Usage costs and invoice-level charges for selected complete months | Back to January 2019 | No | Included, such as taxes and adjustments |
Exam tip: Charge period shows usage costs and can include forecasts, but it excludes invoice-level charges such as taxes. Billing period includes invoice-level charges but does not support forecasts.
Grouping, Filtering, and Forecasting to Explain Spending
Grouping and filtering turn a total spend number into specific cost drivers. Filters narrow data to a service, SKU, project, or label, while Group By reorganizes the chart by project, service, SKU, location, label, or project hierarchy such as folders and organizations. Grouping by project shows which team drives spend, grouping by service shows which product drives spend, and grouping by label such as environment:prod shows the cost of resources sharing a business tag.
Forecasting projects likely spend up to 12 months ahead when the Charge period ends on a future date, with the header showing actual cost-to-date plus predicted cost for each future day. The machine learning model follows an ordered flow:
- Gathering historical data: Collect historical spend matching the selected filters.
- Smart data preparation: Handle outliers, fill usage gaps, and detect shifts such as new projects.
- Accounting for seasonality and trends: Recognize daily, weekly, and monthly cycles and growth or decline.
- Comprehensive data regularization: Structure costs over time for stable time-series analysis.
Forecasts are not available with a Billing period or when filtering on Products, Originating products, Spend-based CUDs, or Originating services. If actual costs diverge from the forecast, the gap can signal an anomaly, and narrowing by service, SKU, or project helps isolate whether one project or SKU caused the change. Cost details can lag because services report at varying intervals, typically within a day but sometimes more than 24 hours.
Cost Breakdown, Budgets, and Exports for Governance
Visualized cost data enforces policy when connected to budgets, savings analysis, and deeper review. Cloud Billing budgets track actual spend against planned amounts with threshold rules for email and optional Pub/Sub automation, and a budget can be opened directly in Reports to show variances against the red target line. The Cost breakdown report explains totals by starting from gross on-demand cost and subtracting savings such as committed use discounts, sustained use discounts, and negotiated savings, adding tax and adjustments for Billing period views.
Sharing and long-term analysis keep governance continuous. As settings change the page URL updates so the Share link opens the same view, and Download CSV exports filtered data for further analysis. Cloud Billing export to BigQuery sends detailed usage, cost, and pricing data throughout the day to a BigQuery dataset, so organizations enable export early for complete history, chargeback, and custom Data Studio dashboards.
Key Facts
- Budgets track planned versus actual spending and send alerts at thresholds, while quotas block additional resource creation and spend cap budgets pause new usage for eligible services in a single project until manually lifted.
- Committed Use Discounts require a one-year or three-year commitment, Sustained Use Discounts are automatic credits for continuous Compute Engine or GKE use with no commitment, and Spot VMs use spare capacity at more than 80% lower cost with risk of preemption.
- Costs flow upward from resources to projects to folders to the Organization for reporting, while a Cloud Billing account pays for all linked projects without granting IAM inheritance.
- New Cloud Billing budgets start with 50%, 90%, and 100% thresholds on actual spend, forecasted alerts work only for recurring calendar budgets, and an alerts-only budget never stops usage or billing.
- Charge period shows actual usage costs and supports forecasts up to 12 months ahead but excludes invoice charges, while Billing period includes taxes, credits, and adjustments but does not support forecasts.
Frequently Asked Questions
What is the difference between budgets and quotas in Google Cloud financial governance?
Budgets track planned versus actual spending for a team or project and send alerts at thresholds so stakeholders can decide how to adjust allocation, while quotas limit how much can be provisioned or consumed and block additional resource creation when the limit is reached. Alerts alone do not fix spending because action by administrators to review data and right-size resources is still required.
When should I use Committed Use Discounts (CUDs), Sustained Use Discounts (SUDs), or Spot VMs in Google Cloud?
Committed Use Discounts (CUDs) should be used when usage is predictable and steady over one year or three years in exchange for committing to a minimum quantity or spend. Sustained Use Discounts (SUDs) should be used when Compute Engine or Google Kubernetes Engine (GKE) usage is steady through the month but no long-term commitment is wanted, because they are automatic credits for continuous use during a billing cycle. Spot VMs should be used when workloads are fault-tolerant and flexible, such as batch jobs that can tolerate preemption, because they use unused capacity at more than 80 percent lower cost than regular VMs.
What is a spend cap budget in Google Cloud and how does it work?
A spend cap budget is a stricter type of budget that automatically blocks new usage for eligible services in a single project when gross, estimated costs exceed 100 percent of the budget amount. It is limited to a single project and a single eligible service with a monthly period starting on the first day of the month, and its calculations use gross costs without savings and credits. Alert emails are sent when spend exceeds 50 percent and 80 percent of the cap, persistent resources such as compute and storage are not paused, and normal service returns only after manual intervention to lift the cap.
What is the difference between Charge period and Billing period in Cloud Billing Reports?
Charge period shows actual usage and cost incurred during the selected dates and supports forecasts up to 12 months ahead, but it excludes invoice-level charges such as taxes. Billing period shows usage costs and invoice-level charges such as taxes, credits, and adjustments for selected complete months, but it does not support forecasts.
Subdomains
Resource grouping for governance and cost management is the practice of organizing Google Cloud resources into a logical hierarchy so access, rules, and spending can be controlled from central points.…
Financial guardrails in Google Cloud are the combination of spending plans and consumption limits that keep cloud costs visible and under control. Budgets track planned versus actual spending and …
Cloud Billing Reports is a Google Cloud console page that visualizes usage costs for a Cloud Billing account and all projects linked to that account. The page helps organizations monitor curre…
Cost governance and accountability tools in Google Cloud organize who pays for resources, assign costs to owners, and keep spending within plan. The main structural pieces are the **resource hierarchy…
Financial governance and consumption control benefits are the cost and stability gains that come from limiting how much cloud can be used and watching how much is spent. Resource quota policies cap ho…
Budgets, quotas, and cost controls in Google Cloud work together to make spending predictable and to keep resource use inside clear boundaries. Cloud Billing Budgets set financial targets and send…
How learners score on this domain
Last updated