Fundamental
Prepare and test your skills
Fundamental
Prepare and test your skills
SRE, DevOps and Observability on Google Cloud
Site Reliability Engineering (SRE) (opens in a new tab) and DevOps are complementary approaches for delivering software quickly without breaking reliability. SRE is the discipline Google developed to run global infrastructure reliably and efficiently for billions of users. DevOps is a broad collection of processes, culture, and tooling that breaks down silos between development, operations, and related teams to improve agility and reduce time-to-market. Organizations can adopt the full SRE discipline or apply only the parts that fit their business and collaboration processes.
How SRE and DevOps Work Together
How SRE and DevOps work together is best understood by their different primary focuses and shared goal of better software quality. SRE focuses on running reliable systems at scale through efficiency and reliability practices. DevOps focuses on how teams build, deliver, and improve software together through agility and faster delivery. DevOps increases the pace of change, while SRE protects reliability as that change happens.
| Discipline | Primary focus | Main goal | Key practices |
|---|---|---|---|
| SRE | Running reliable systems at scale | Efficiency and reliability | Eliminate toil, monitor everything, codify infrastructure, manage incidents, blameless postmortems |
| DevOps | Processes, culture, and tooling | Agility and reduced time-to-market | Break silos, continuous integration, automated testing, deployment automation |
SRE recommends eliminating toil through automation, monitoring everything, codifying infrastructure, managing incidents, and conducting blameless postmortems. DevOps uses automated testing, continuous integration, deployment automation, feedback, and continuous improvement to move changes safely into production.
Service Level Objectives, Agreements, and Error Budgets
Service level objectives, agreements, and error budgets are the measurements SRE uses to balance stability with innovation. A service level objective (SLO) is a specific, measurable target inside a service level agreement (SLA). An SLA is the entire agreement that specifies what service is provided, how it is supported, times, locations, costs, performance, penalties, and responsibilities of the parties involved. An SLA can contain many SLOs that measure availability, throughput, frequency, response time, or quality.
SLA, SLO, and Error Budget Relationships
Concept MapA concept map showing that a service level agreement is the whole agreement, containing one or more measurable service level objectives, each with an error budget of tolerated unreliability before the SLO is violated, with Cloud Monitoring SLIs providing the metrics that track SLOs over time.
Exam tip: An SLA is the entire agreement, while an SLO is a specific measurable target inside that agreement.
Recovery Objectives, High Availability, and Disaster Recovery
Recovery objectives, high availability, and disaster recovery define how much downtime and data loss a business can accept. Recovery time objective (RTO) is the maximum acceptable time an application can be offline, and recovery point objective (RPO) is the maximum acceptable time during which data might be lost. Smaller RTO and RPO values mean faster recovery but usually higher cost and administrative complexity. High availability (HA) ensures an agreed level of operational performance, usually uptime, for a higher than normal period, and HA is often considered when setting RTO and RPO values.
Disaster recovery planning (opens in a new tab) on Google Cloud costs less and is less complex than on-premises planning because Google Cloud removes work related to capacity, facilities, network infrastructure, bandwidth, and support. Google Cloud provides a global network, redundancy across points of presence, automatic data mirroring, scalability, and security features that support recovery planning. Managed services such as Cloud Run, Compute Engine, and Firestore provide automatic scaling, and Memorystore for Redis can run in a high-availability configuration with cross-zone replication and automatic failover. Caching can also increase resiliency through graceful degradation, where the cache continues to handle requests even if underlying storage is overloaded or unavailable.
Reliable Delivery Through Testing and Deployment Automation
Reliable delivery through testing and deployment automation means verifying changes before release and exposing new versions gradually. Design for testability uses unit, integration, and system tests to verify that an application behaves as expected and can progress to the next deployment stage. Unit tests should form the bulk of testing because they are quick and straightforward to maintain, while higher-level integration and system tests should be automated. More test coverage reduces uncertainty and lowers the chance that each code change reduces reliability.
A good deployment strategy gradually increases exposure of new versions to larger audiences, verifies behavior along the way, and defines rollback provisions if problems occur. Automated testing within continuous integration and continuous delivery (CI/CD) pipelines validates changes before deployment and reduces errors and regressions. Cloud Build and Jenkins can implement continuous integration, while Cloud Build and Cloud Deploy can manage pipelines that include unit, integration, and end-to-end tests.
Learning From Failure and Improving Continuously
Learning from failure and improving continuously treats failure as something to test and learn from rather than only avoid. Resilience testing introduces failures in a structured way, escalating from basic to severe, such as introducing intermittent failures, blocking access to service dependencies, blocking all network communication, and terminating hosts. With a service mesh such as Istio, teams can inject faults at the application layer, inject corrupting packets at the TCP layer, introduce delays to simulate latency or an overloaded upstream system, or introduce aborts that mimic upstream failures. Scaling behavior should also be tested with automated nonfunctional and load testing to verify that key metrics, resource counts, and edge cases behave correctly when limits are reached or load suddenly returns.
SRE practices for dealing with real failure include managing incidents with structured processes and performing blameless postmortems that examine causes and responses. Retrospectives after project milestones, major incidents, or significant testing cycles help improve incident response and testing strategies, often using a start-stop-continue model. Continuous improvement (opens in a new tab) also uses user feedback, key performance indicators (KPIs), and metrics tracked with Cloud Monitoring and analyzed with BigQuery to identify trends, patterns, and anomalies.
The Optimization Loop for Operations
The optimization loop (opens in a new tab) is a repeatable four-step cycle for improving environments, teams, and operations. The optimization loop establishes a baseline, sets measurable goals, makes improvements, and then refines the process itself so future iterations are more repeatable.
Optimization Loop in 4 Steps
Process Flow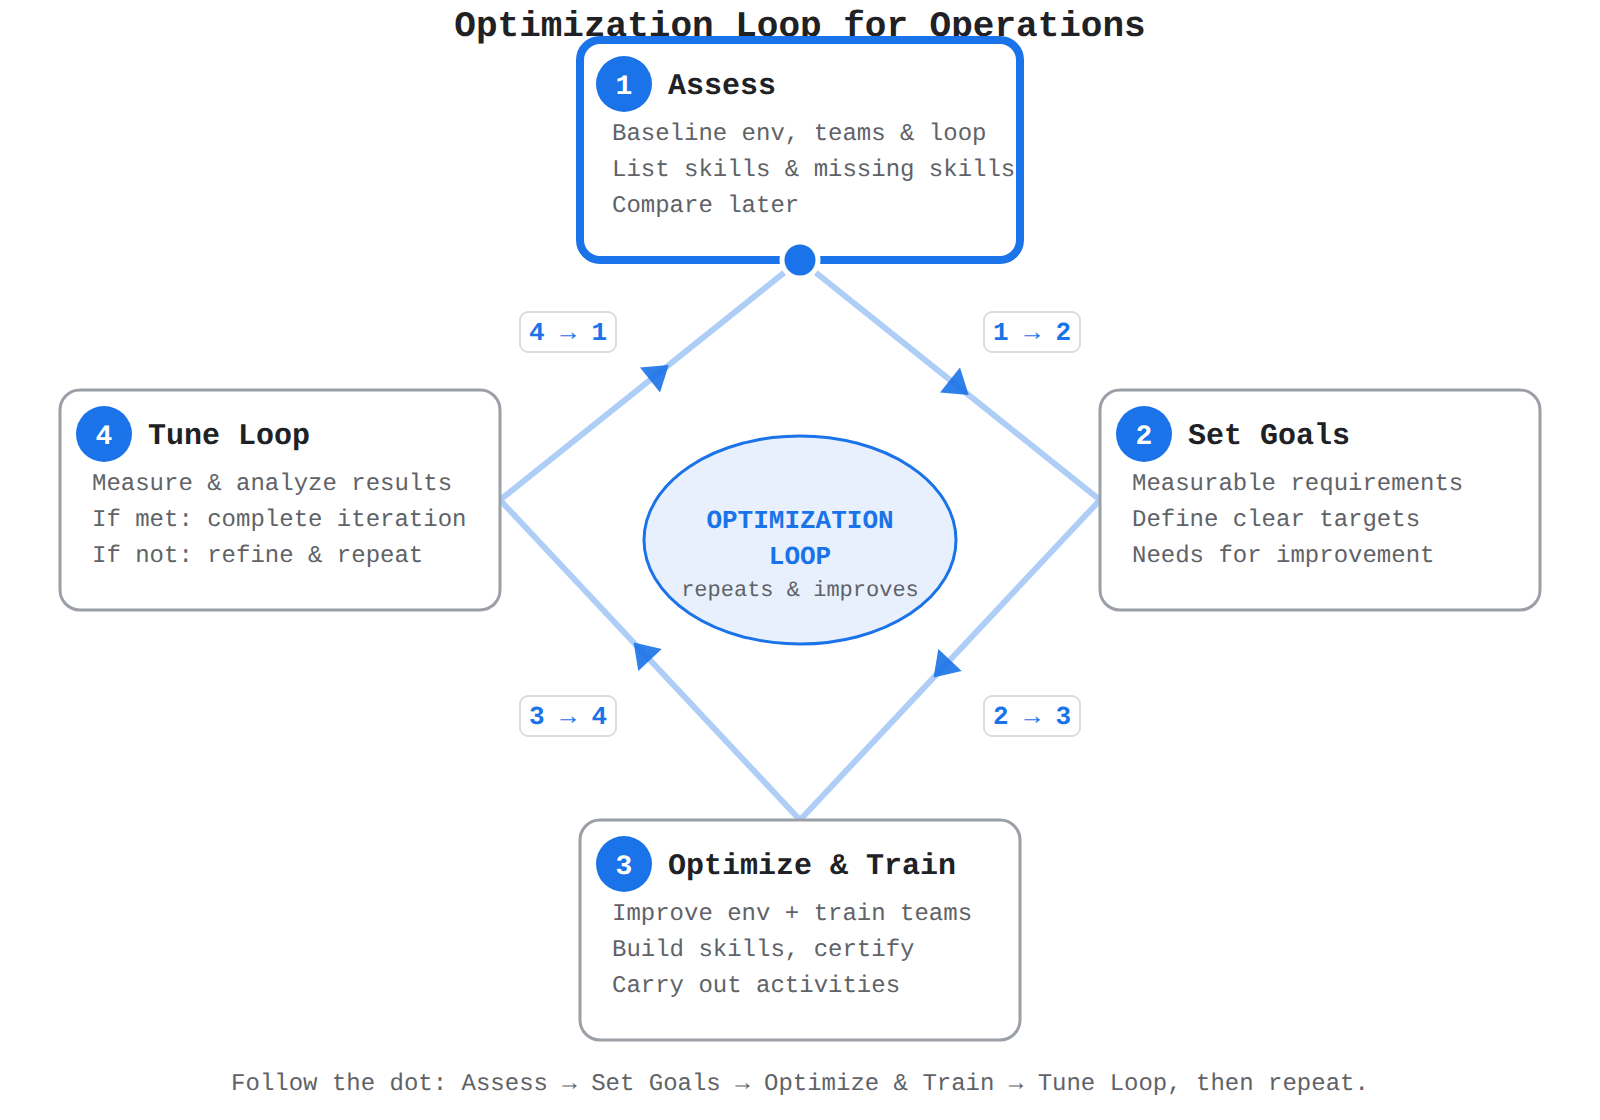
Four cards in a diamond show Assess, Set Goals, Optimize and Train, and Tune Loop in order. A dot travels the diamond track with 1→2, 2→3, 3→4, 4→1 labels, and each step highlights in sequence.
- Assess the environment, teams, and loop: Establish a baseline for later comparison and list team skills, expertise levels, and missing skills.
- Establish optimization requirements and goals: Express needs for improvement as requirements and define clearly measurable goals.
- Optimize the environment and train the teams: Carry out optimization activities and build needed skills through training and certifications.
- Tune the optimization loop: Measure and analyze results, complete the iteration if goals were met or refine goals and return to optimization if they were not.
An error budget is the amount of unreliability a service can tolerate before it violates its SLO, and it is the SRE mechanism for deciding when to prioritize stability over innovation. Cloud Monitoring provides service level indicators (SLIs), which are specific metrics used to measure and track SLOs over time.
Infrastructure as Code (IaC) (opens in a new tab) and automation reduce operational toil by replacing manual, repetitive work with code, scheduled jobs, and managed services. Operational toil is manual work that grows with the environment and consumes time without improving the service. Google Cloud supports this modernization through IaC, automation services, monitoring, autoscaling, and CI/CD pipelines that make deployments consistent, repeatable, and testable.
Operational Toil and Automation Tools
Operational toil and automation tools explain why SRE recommends eliminating toil by increasing automation. Saved time from automation can be reinvested in higher-value work such as optimization activities that improve reliability and efficiency. Not all automation requires specialized software engineering skills or great effort, since sometimes a short script run periodically can save several hours per day. Google Cloud provides Google Cloud CLI (opens in a new tab), Cloud APIs, Cloud Scheduler, Managed Service for Apache Airflow, and Cloud Run to automate repetitive tasks and reduce human error.
Infrastructure as Code for Repeatable Deployments
Infrastructure as Code for repeatable deployments defines and manages infrastructure through code rather than manual configuration. Google Cloud exposes well-defined interfaces such as Cloud APIs to provision, configure, and manage resources, so teams can use their own choice of IaC tools and version control systems. An IaC process supports rollback because any change to the code that describes infrastructure can be reverted, and it lets teams test changes before updating infrastructure to avoid unexpected failures. Teams can adopt IaC early in optimization iterations or gradually to evaluate whether it suits their environment.
| Aspect | Tool or approach | Purpose |
|---|---|---|
| Provisioning | Terraform | Provision Google Cloud resources |
| Configuration | Ansible, Chef, Puppet | Configure resources after provisioning |
| Policies | Open Policy Agent | Define policies as code |
| Operations | GitOps | Define operations as code |
This codification makes deployments consistent and repeatable, which supports global scalability and operational reliability.
Monitoring and Autoscaling as Operational Automation
Monitoring and autoscaling as operational automation turn measured data into automatic action on capacity. If an environment cannot gather detailed measures, it cannot be improved because there is no data to back up assumptions. A comprehensive monitoring system should monitor all essential metrics and at minimum the four golden signals. Managed Monitoring and Logging services let teams monitor without a complicated setup, while Cloud Monitoring and Recommender can identify right-sizing opportunities and alerts can notify administrators when thresholds are met.
Exam tip: Monitoring provides the data that makes automation safe: use Monitoring and Logging to measure the environment, then use autoscaling or scheduled jobs to act on that data.
| Autoscaling option | What scales | How it works |
|---|---|---|
| Compute Engine managed instance groups (MIGs) | Groups of virtual machines | Policies specify minimum and maximum machines and trigger scaling on conditions such as CPU utilization thresholds |
| Google Kubernetes Engine (GKE) (opens in a new tab) autoscaling | Cluster resources | Cluster Autoscaler adds or removes nodes for Pod demands, Horizontal Pod Autoscaler changes Pod replicas, Vertical Pod Autoscaler tunes requests and limits, and Node Auto-Provisioning creates optimized node pools |
| Cloud Run (opens in a new tab) | Instances | Built-in autoscaling adjusts instance count from incoming traffic, scaling up when traffic increases and down when traffic decreases |
Autoscaling dynamically adjusts capacity from workload fluctuations, so resources are available when needed and over-provisioning and unnecessary costs are avoided.
Automating Delivery, Networking, and Compliance
Automating delivery, networking, and compliance extends repeatability from infrastructure to releases, networks, and policy enforcement. Automated testing within CI/CD pipelines validates changes before deployment, which reduces errors and regressions and builds a more stable system with unit, integration, and end-to-end tests. Cloud Build and Cloud Deploy create and manage those pipelines. In networking, Google Cloud virtualizes the physical network layer with software-defined networking (SDN), so teams can automatically deploy and tear down environments consistently with IaC tools such as Terraform.
Compliance automation uses consistent naming and grouping to classify resources and enforce policies:
- Security marks classify resources to provide security insights from Security Command Center and to enforce policies on groups of resources.
- Labels track resource spend in Cloud Billing and provide extra insights in Cloud Logging.
- Tags for firewalls define sources and targets in global network firewall policies and regional network firewall policies.
Cloud-ready applications designed with containers, service meshes, microservices, immutable infrastructure, and declarative APIs are scalable, resilient, manageable, and observable. Google Cloud managed services such as GKE, Cloud Run, Cloud Service Mesh, Logging, and Monitoring help teams design and run those applications.
Google Cloud Observability (opens in a new tab) (formerly Stackdriver) is a set of monitoring, logging, and diagnostic tools that show how applications and infrastructure perform across the full stack. The suite helps teams see availability, usage, and performance in one place so they can detect problems, find their cause, and fix them faster. The suite is built from services that each handle a different kind of telemetry: metrics, logs, traces, and errors.
Core Services for Full-Stack Observability
Core services for full-stack observability each collect a different signal and answer a different question about system health. Cloud Monitoring collects metrics, events, and metadata from resources and turns them into dashboards, charts, and alerts. Cloud Logging stores, searches, analyzes, monitors, and alerts on log data and events. Cloud Trace is a distributed tracing system that collects latency data and displays it in near real time in the Google Cloud console. Error Reporting aggregates and displays errors produced in running applications.
| Service | Data collected | Primary use |
|---|---|---|
| Cloud Monitoring | Metrics, events, metadata | Dashboards, charts, and alerts on health and performance |
| Cloud Logging | Log data and events | Store, search, analyze, monitor, and alert on logs |
| Cloud Trace | Latency data and traces | Distributed tracing with near real-time latency view |
| Error Reporting | Errors from running apps | Aggregate and display errors |
How Telemetry Flows Into the Suite
How telemetry flows into the suite starts with instrumentation libraries that send signals from application code to Google Cloud. For .NET, one instrumentation library (opens in a new tab) supports Error Reporting and Cloud Trace, while another supports Error Reporting, Logging, and Trace. Once collected, quantitative performance data is exported as standard Google Cloud metrics to Cloud Monitoring, while qualitative state changes and alarms are exported as structured logs to Cloud Logging. This split lets teams view network architecture and performance in a single pane of glass.
Monitoring policies (opens in a new tab) control monitoring behavior by linking a Monitoring Point as the source to a destination as the target. The policies determine which Monitoring Points run tests, on what targets, and how frequently. These policies generate paths that visualize the route taken by probe packets, including network paths at Layers 3 and 4 and web paths at Layer 7.
Tracing, Sampling, and Correlation
Tracing, sampling, and correlation in Cloud Trace record the path of a request so teams can see where latency is added. Instrumentation libraries automatically create spans at remote procedure call (RPC) boundaries, and developers can add annotations and tags to existing spans or create child spans for finer detail. Because each component in a request path makes its own sampling decision, a span cannot be forced to be sampled. Teams can set the sampled flag in the trace header to true as a hint to downstream components, while Google Cloud services accept that hint but still enforce their own sampling rate limits.
Exam tip: You cannot force spans to be sampled. Setting the sampled flag in the trace header is only a hint to downstream components, and each component still makes its own sampling decision.
Exemplars connect metrics to traces by attaching a representative sample request or span to a metric measurement. An exemplar can contain a link to a trace, which lets a team move from a metric spike on a dashboard directly to the trace that caused it. This shortens the path from knowing something is wrong to knowing why it is wrong.
Managing Cost and Responding to Alerts
Managing cost and responding to alerts keeps observability affordable while ensuring the right people are notified. The Cloud Monitoring Metrics Management page reports information that helps control spending on billable metrics without losing observability. It shows ingestion volumes for byte- and sample-based billing, data about labels and cardinality, read counts for each metric, use of metrics in alerting policies and custom dashboards, and the rate of metric-write errors. By default the page shows metrics collected in the previous one day, and teams can exclude unneeded metrics to eliminate ingestion costs.
Alert policies deliver notifications when a metric crosses a threshold, while Personalized Service Health (opens in a new tab) shows Google-side events, impacted products, and locations affecting a project or organization. During an incident, teams first detect and scope whether the problem originates from their own project or from Google, then mitigate, resolve, or escalate using workarounds and expected resolution times. Personalized Service Health should be used alongside other signals because a product can have an incident in one location while a project elsewhere is unaffected, and the service cannot know whether an application requires all dependent products. If an issue does not appear in the dashboard, teams should contact Support (opens in a new tab).
How the Suite Reduces Mean Time to Resolution
How the suite reduces mean time to resolution (MTTR) depends on bringing detection, diagnosis, and resolution signals into one console. Cloud Monitoring and Cloud Logging surface the symptom, while Cloud Trace and exemplars point to the specific request or span where latency or failure occurred. Error Reporting groups the errors involved, alert policies push the signal to the right people, and Personalized Service Health tells them whether the cause is inside their project or on Google's side. Because all signals land in one place, teams avoid switching between tools and move from detection to diagnosis to resolution in fewer steps.
Key Facts
- Site Reliability Engineering (SRE) protects reliability at scale while DevOps improves agility by breaking down silos between development, operations, and related teams.
- A service level agreement (SLA) is the entire agreement for a service, a service level objective (SLO) is a specific measurable target inside that agreement, and an error budget is the amount of unreliability allowed before the SLO is violated.
- Infrastructure as Code uses tools such as Terraform for provisioning, Ansible, Chef, or Puppet for configuration, Open Policy Agent for policies as code, and GitOps for operations as code.
- Google Cloud Observability combines Cloud Monitoring for metrics, Cloud Logging for logs, Cloud Trace for latency data, and Error Reporting for aggregated application errors.
- Setting the sampled flag in the trace header to true is only a hint to downstream components because each component makes its own sampling decision.
Frequently Asked Questions
What is the difference between a Service Level Agreement (SLA) and a Service Level Objective (SLO)?
A Service Level Agreement is the entire agreement that specifies what service is provided, how it is supported, times, locations, costs, performance, penalties, and responsibilities of the parties involved, while a Service Level Objective is a specific, measurable target inside that agreement. An SLA can contain many SLOs that measure availability, throughput, frequency, response time, or quality.
How do Site Reliability Engineering (SRE) and DevOps work together?
Site Reliability Engineering focuses on running reliable systems at scale through efficiency and reliability practices, while DevOps focuses on how teams build, deliver, and improve software together through agility and faster delivery. DevOps increases the pace of change, while SRE protects reliability as that change happens.
What is the difference between Recovery Time Objective (RTO) and Recovery Point Objective (RPO)?
Recovery Time Objective is the maximum acceptable time an application can be offline, while Recovery Point Objective is the maximum acceptable time during which data might be lost. Smaller RTO and RPO values mean faster recovery but usually higher cost and administrative complexity.
What services make up Google Cloud Observability and what does each service do?
Google Cloud Observability combines Cloud Monitoring for metrics, Cloud Logging for logs, Cloud Trace for latency data, and Error Reporting for aggregated application errors. Cloud Monitoring collects metrics, events, and metadata for dashboards, charts, and alerts, Cloud Logging stores, searches, analyzes, monitors, and alerts on log data and events, Cloud Trace collects latency data for distributed tracing, and Error Reporting aggregates and displays errors produced in running applications.
Sample Question
An e-commerce company recently migrated its applications to Google Cloud. During a high-traffic event, customers experience slow checkout times, and the IT operations team takes hours to diagnose the issue because their telemetry data is siloed. The company wants to modernize its operations to meet the following goals:
- Achieve full-stack observability across infrastructure, databases, and applications
- Centralize monitoring, logging, and performance tracing in a single environment
- Reduce the mean time to resolution (MTTR) when system incidents occur
Which solution should the company implement to meet these requirements?
Create a centralized knowledge base in Google Workspace to store troubleshooting runbooks and escalation paths
Conduct blameless post-incident reviews (PIRs) after outages to document timelines and root causes
Adopt Google Cloud Observability to unify metrics, logs, and traces across the environment
Use Cloud Load Balancing with stress testing tools to simulate peak traffic against the checkout service
How learners score on this domain
Last updated