Fundamental
Prepare and test your skills
Fundamental
Prepare and test your skills
Comparing Department Distributions with Seaborn Boxplots
Free sample question, answered and explained below. The Associate Data Practitioner practice bank has 1,156 more like it. Try 10 free: instant score, no account.
A data analyst has loaded transaction records from BigQuery into a pandas DataFrame within a Colab Enterprise notebook. The dataset includes continuous numerical transaction amounts across several store departments. The analyst needs to visualize the statistical distribution of transaction amounts for each department to easily compare the median, interquartile ranges, and identify potential outliers.
Which Python visualization approach should the analyst use to meet these requirements?
Explanations
Use Seaborn's lineplot() function (sns.lineplot(data=df, x='department', y='amount')) to plot trend lines across departments.
Use Seaborn's lineplot() function (sns.lineplot(data=df, x='department', y='amount')) to plot trend lines across departments.
What Seaborn's lineplot() Does
Seaborn's sns.lineplot() function draws a line plot that connects data points sequentially across an ordered x-axis. By default, it aggregates numerical values sharing the same x-coordinate and plots the mean value accompanied by a shaded 95% confidence interval band.
Why It Doesn't Meet the Requirement
- Designed for ordered/time series data (✗): Line plots imply continuity or sequential progression between adjacent points (such as dates, timestamps, or sequential iterations). Store departments are nominal categorical variables with no inherent order.
- Does not show quartiles or full distributions (✗): While
lineplotshows the mean and confidence intervals, it hides the median, interquartile range (IQR), and min/max boundaries. - Hides individual outliers (✗): Outliers are averaged into the central tendency metric rather than isolated and individually marked as distinct data points.
Key Characteristics of Line Plots
- Best for continuous tracking over time (e.g., daily revenue over a fiscal quarter).
- Assumes linear relationship or sequential continuity along the horizontal axis.
- Misrepresents categorical variables by creating misleading slopes connecting unrelated categories.
This Answer Would Be Correct If
The scenario stated: "Track daily total transaction trends over a 12-month period to observe seasonal changes and calculate confidence intervals over time."
Use Altair's mark_bar() to create a stacked bar chart displaying the cumulative sum of transaction amounts per department.
Use Altair's mark_bar() to create a stacked bar chart displaying the cumulative sum of transaction amounts per department.
What Altair's mark_bar() Does
Altair is a declarative statistical visualization library for Python based on Vega and Vega-Lite. Its mark_bar() method renders bar charts and stacked bar charts by mapping categorical dimensions to visual bars and aggregated numerical values (such as sum(amount) or count()) to bar lengths.
Why It Doesn't Meet the Requirement
- Shows aggregate sums instead of distributions (✗): A stacked bar chart represents aggregate totals (like total revenue), concealing how individual transaction amounts are spread across the value spectrum.
- Hides medians and percentiles (✗): Bar charts present single summary values per category; they do not reveal the 25th, 50th, or 75th percentiles.
- Cannot identify outliers (✗): Extreme values are absorbed into the overall bar length or slice height, making it impossible to spot isolated anomalous transactions.
Key Characteristics of Bar Charts
- Excellent for comparing discrete totals or frequencies across distinct categories.
- Highly effective for ranking categories from highest to lowest volume.
- Ineffective for understanding internal data variance, skewness, or outlier presence.
This Answer Would Be Correct If
The requirement asked to: "Compare the total cumulative sales revenue generated by each department to evaluate overall department contribution to the company's gross income."
Use Matplotlib's pie() function (plt.pie(df['amount'])) to show the proportion of every individual transaction value.
Use Matplotlib's pie() function (plt.pie(df['amount'])) to show the proportion of every individual transaction value.
What Matplotlib's pie() Does
Matplotlib is a foundational 2D plotting library in Python, and its plt.pie() function creates a pie chart. A pie chart displays data as proportional slices of a circular graphic, where each slice represents a part-to-whole relationship.
Why It Doesn't Meet the Requirement
- Cannot show distributions or quartiles (✗): A pie chart shows proportions of a whole, not statistical distributions such as medians, ranges, or quartiles.
- Incapable of showing outliers (✗): Extreme values simply appear as slightly larger slices; there is no statistical mechanism to flag or visualize outliers.
- Unusable for thousands of rows (✗): Passing an entire continuous series of individual transaction amounts creates thousands of overlapping, illegible slivers.
- No side-by-side categorical comparisons (✗): A single pie chart cannot contrast multiple distributions across different store departments simultaneously.
Key Limitations of Pie Charts
- Best suited only for 2 to 7 discrete categorical proportions.
- Human perception struggles to compare angles and areas compared to positions on a common scale.
- Completely ineffective for continuous statistical data exploration.
This Answer Would Be Correct If
The goal was to display the overall percentage share of total company sales contributed by a small handful of top-level categories (e.g., "Display the market share breakdown among 4 main product lines as percentage slices of a total").
Use Seaborn's boxplot() function (sns.boxplot(data=df, x='department', y='amount')) to generate side-by-side box plots for each department.
Use Seaborn's boxplot() function (sns.boxplot(data=df, x='department', y='amount')) to generate side-by-side box plots for each department.
What Seaborn's boxplot() Is
Seaborn is a popular Python data visualization library built on top of Matplotlib that closely integrates with pandas DataFrames. The sns.boxplot() function renders a box-and-whisker plot, which visually summarizes the distribution of a continuous numerical variable across different categorical levels using standard statistical metrics.
How It Meets the Requirements
- Statistical distribution (✓): A box plot displays the five-number summary of a dataset: the minimum, first quartile (Q1 / 25th percentile), median (Q2 / 50th percentile), third quartile (Q3 / 75th percentile), and maximum.
- Outlier detection (✓): Any observations falling beyond 1.5 times the interquartile range (IQR) from the quartiles are automatically plotted as distinct outlier points (whiskers extend to the most extreme non-outlier data points).
- Category comparison (✓): By mapping
x='department'andy='amount', Seaborn places box plots side by side for each department on the categorical axis, enabling immediate visual comparison. - Pandas DataFrame integration (✓): The
data=dfargument allows seamless column referencing directly from the underlying pandas DataFrame in a notebook environment.
Box Plot Five-Number Summary Explained
Annotated Structure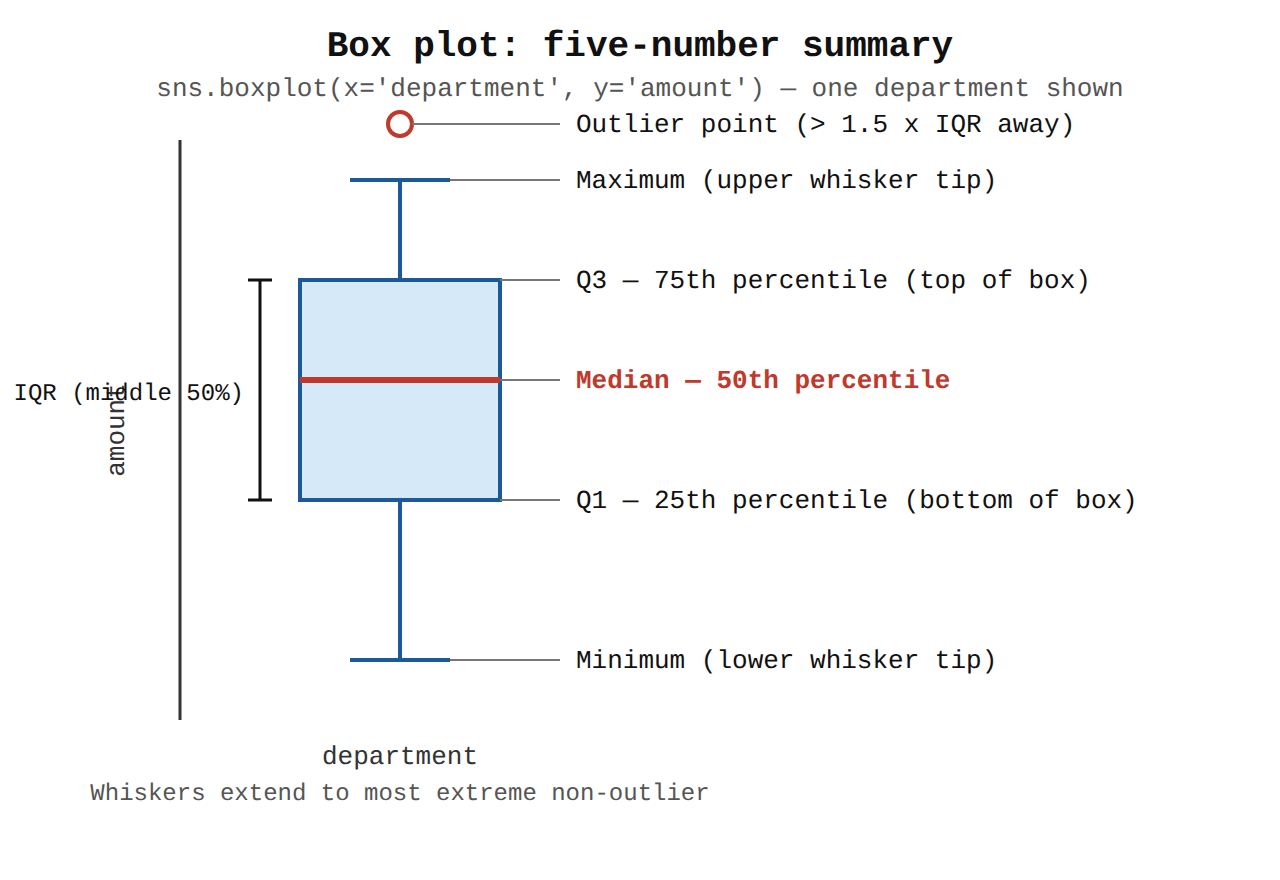
Key Advantages and Capabilities
- Compact summary: Condenses thousands of data rows into an easily interpretable distribution summary without visual clutter.
- Built-in statistical aggregation: Computes quartiles and outlier boundaries automatically without requiring manual pandas aggregation code.
- Aesthetic styling: Applies high-level default themes, color palettes, and axis labeling out of the box.
- Customization options: Supports hue grouping, custom palettes, orientations, and whisker definitions.
Why This Is Optimal
Compared to bar charts, line plots, or pie charts, a box plot is the standard statistical chart designed specifically to reveal medians, spread, skewness, and outliers across categories in a single view.
Try 10 interactive questions like this one, free
Answer them yourself and get your score the moment you finish. No account needed.
Full access includes
- 1,156 practice questions across all 4 exam domains
- Every answer explained: why it is right, and why the others are not
- Scout, an AI tutor that answers your follow-up questions
- Readiness tracking by domain, so you know when to book the exam
Related questions
Keep the momentum going with these hand-picked practice scenarios
FundamentalAssociate Data Practitioner
BigQuery Notebooks Variable Interpolation
Use Jupyter notebooks to analyze and visualize data (e.g., Colab Enterprise)
FundamentalAssociate Data Practitioner
BigQuery DataFrames Pandas API
Use Jupyter notebooks to analyze and visualize data (e.g., Colab Enterprise)
FundamentalAssociate Data Practitioner
Pub/Sub BigQuery Subscriptions
Identify use cases for event-driven data ingestion from Pub/Sub to BigQuery
FundamentalAssociate Data Practitioner
BigQuery Data Transfer Service and Dataform for ELT
Differentiate between different data manipulation methodologies (e.g., ETL, ELT, ETLT)
FundamentalAssociate Data Practitioner
BigQuery ML Linear Regression
Execute SQL to create, train, and evaluate models using BigQuery ML
AdvancedProfessional Cloud DevOps Engineer
Cloud Workstations Custom Container Images
Bootstrapping environments with required tooling (e.g., custom images, IDE, Cloud SDK)
Last updated