Diagram
Distributed Tracing Request Correlation
Sequence
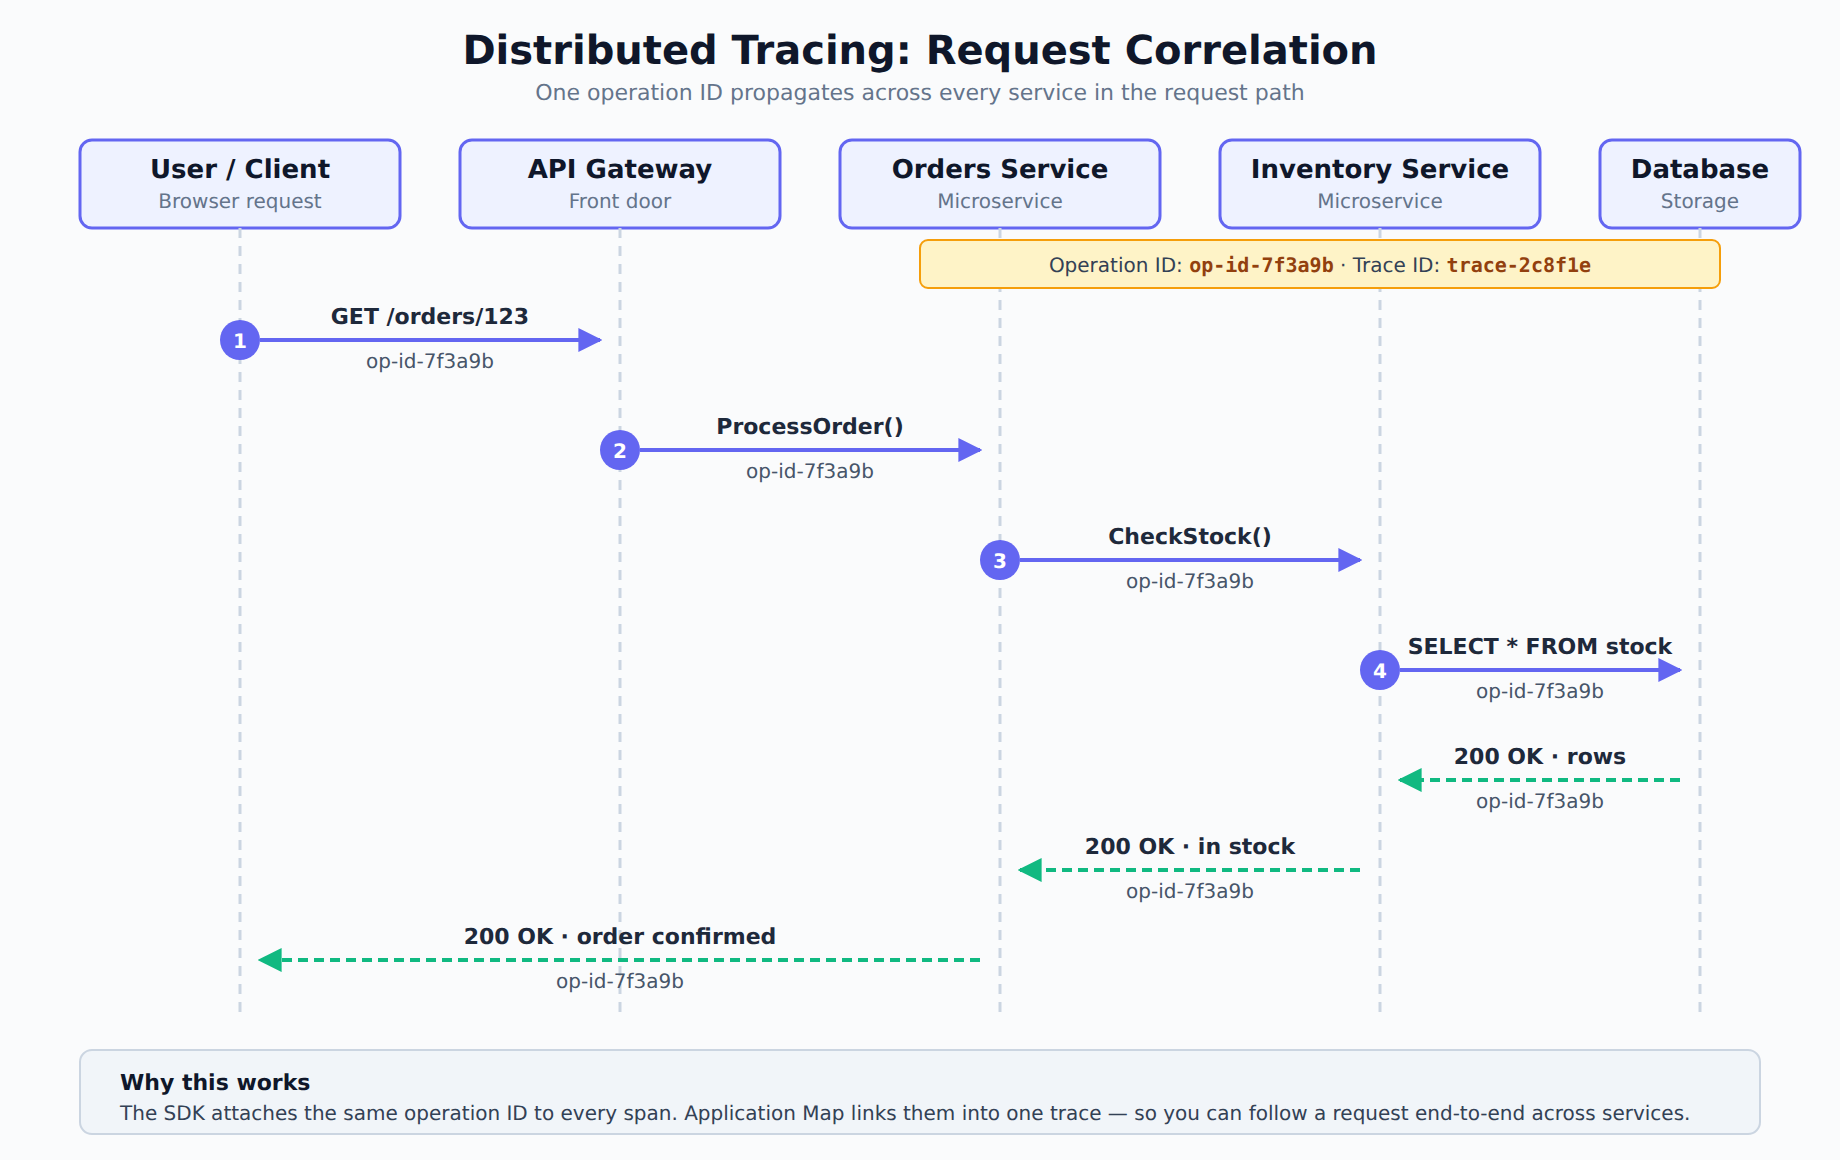
A sequence diagram showing a user request flowing through API Gateway, Orders Service, Inventory Service, and Database, with the same operation ID propagating across each service-to-service call and response.
In the Domain
Configuring Application Insights SDK
Distributed tracing in Application Insights works by attaching an operation identifier to every request and passing that identifier from one service to the next. To enable this, you must configure the Application Insights SDK in each microservice of your application. For .NET services, you integrate the SDK with the logging framework, such as ILogger. For services written in other languages, you use the appropriate Azure Monitor exporter or the OpenTelemetry SDK to send trace telemetry. Once configured, the SDK automatically propagates the operation identifier so that all parts of a single request are linked together, even when the request crosses multiple services. This automatic propagation is what makes distributed tracing possible across a complex system.
Domain 2 of 2
Analyze metrics from instrumentation
Read the Domain summaryPractice this Domain
11 practice questions
Practice this DomainLast updated