Seeking the thrill of transformative tech? Explore the art of designing and implementing DevOps solutions on Azure. Master the shift towards CI/CD, testing, and delivery, while preparing for the Designing and Implementing Microsoft DevOps Solutions exam!
Prepare and test your skills

Prepare and test your skills
To inspect infrastructure performance, you start by collecting data on CPU, memory, disk, and network usage. Azure Monitor gathers these metrics from all your Azure resources, such as virtual machines, databases, and app services. By watching CPU load, you can spot when a server is working too hard. Memory metrics help you find leaks or insufficient RAM. Disk I/O (input/output) speeds and operation counts reveal storage bottlenecks, and network traffic rates show potential congestion or connectivity problems. Azure Monitor stores this data as time-series metrics and logs, giving you a historical view of how each resource behaves.
Raw metrics alone are not enough; you need to correlate them with what your application code is doing. Application Insights Profiler captures detailed performance traces from your running application and links them to the infrastructure metrics. For example, it can show that a spike in CPU usage corresponds to a specific method call in your code. The Code Optimizations feature then analyzes those traces and suggests fixes, such as rewriting a slow database query or caching repeated data. This relationship between infrastructure metrics and application code is what turns raw numbers into actionable insights.
Once you understand normal utilization patterns, you set up threshold-based alerts in Azure Monitor. For instance, you can create an alert that fires when CPU usage stays above 90% for five minutes, or when disk queue length exceeds a critical value. When an alert triggers, it can automatically scale out resources, send a notification to an operations team, or run a remediation script. This proactive approach prevents performance issues from reaching end users and keeps your application responsive.
The insights from monitoring, analysis, and alerting drive optimization decisions. If memory usage is consistently high, you might increase the size of your virtual machines or add more instances behind a load balancer. If disk I/O is a bottleneck, you could switch to a faster storage tier or move frequently accessed data to a cache. Code-level improvements, such as reducing unnecessary loops or optimizing database queries, also reduce CPU and memory pressure. By continuously correlating the four key metrics—CPU, memory, disk, and network—you can make data-driven choices that improve reliability, reduce latency, and lower costs.
Understanding how your application behaves in production requires collecting and analyzing telemetry data. Application Insights gathers two main types of data: telemetry from your server-side code and telemetry from client-side web pages. On the server, it captures HTTP requests that come into your application, information about external services your code calls (like databases or storage), error logs called exceptions, and performance measurements like CPU and memory usage. It also allows developers to create custom events and metrics that track business-specific information, plus detailed trace logs that record what the code is doing step by step. From the client side, Application Insights captures uncaught exceptions that occur in the user's browser, network requests the webpage makes, and information about the users themselves including their devices and browsing sessions. This combined view lets you see the full picture of how your application performs from the user's perspective.
Once you enable Application Insights, two tools help you monitor your application in real time. Live metrics show what's happening right now, updating continuously so you can diagnose problems as they occur. The Application Map provides a visual representation of your application's structure, showing all the components and services that make up your system. This map highlights where bottlenecks or failures are happening, making it easier to identify which part of your application needs attention. By studying this data, you can spot problems before they affect users and make informed decisions about improvements.
To keep your application running smoothly, you need to track several key performance indicators. Request rates tell you how many users are accessing your application at any given time, while response times show how quickly the application answers those requests. Failure rates reveal how often requests result in errors. By comparing these metrics, you can identify when usage peaks coincide with performance problems, helping you understand whether increased traffic is causing slowdowns or failures. You should also monitor dependency performance, which measures how long external services take to respond. If a database or API call is slow, it can drag down your entire application's performance. Finally, examining exceptions and logs helps you understand what specific errors are occurring and why, giving you the details needed to fix bugs and improve reliability.
Trace logs provide a breadcrumb trail of your application's activities, which is invaluable when investigating problems. To get the most from traces, integrate Application Insights with your logging framework (such as ILogger in .NET) so that trace messages flow automatically into your telemetry data. When analyzing traces, look at them alongside exception data to gain context about what was happening when an error occurred. Each log entry should include contextual identifiers like operation IDs, which link related log entries together and make it easier to follow the sequence of events leading to a problem. The goal is to maintain service-level objectives, which are promises about how fast and reliable your application should be.
To ensure your application remains accessible to users, configure availability tests that periodically check whether your endpoints are responding correctly. These tests run automatically from different geographic locations and alert you when an endpoint becomes unavailable or responds too slowly. By monitoring critical endpoints this way, you can detect and fix outages before most users even notice them.
Distributed tracing in Application Insights works by attaching an operation identifier to every request and passing that identifier from one service to the next. To enable this, you must configure the Application Insights SDK in each microservice of your application. For .NET services, you integrate the SDK with the logging framework, such as ILogger. For services written in other languages, you use the appropriate Azure Monitor exporter or the OpenTelemetry SDK to send trace telemetry. Once configured, the SDK automatically propagates the operation identifier so that all parts of a single request are linked together, even when the request crosses multiple services. This automatic propagation is what makes distributed tracing possible across a complex system.
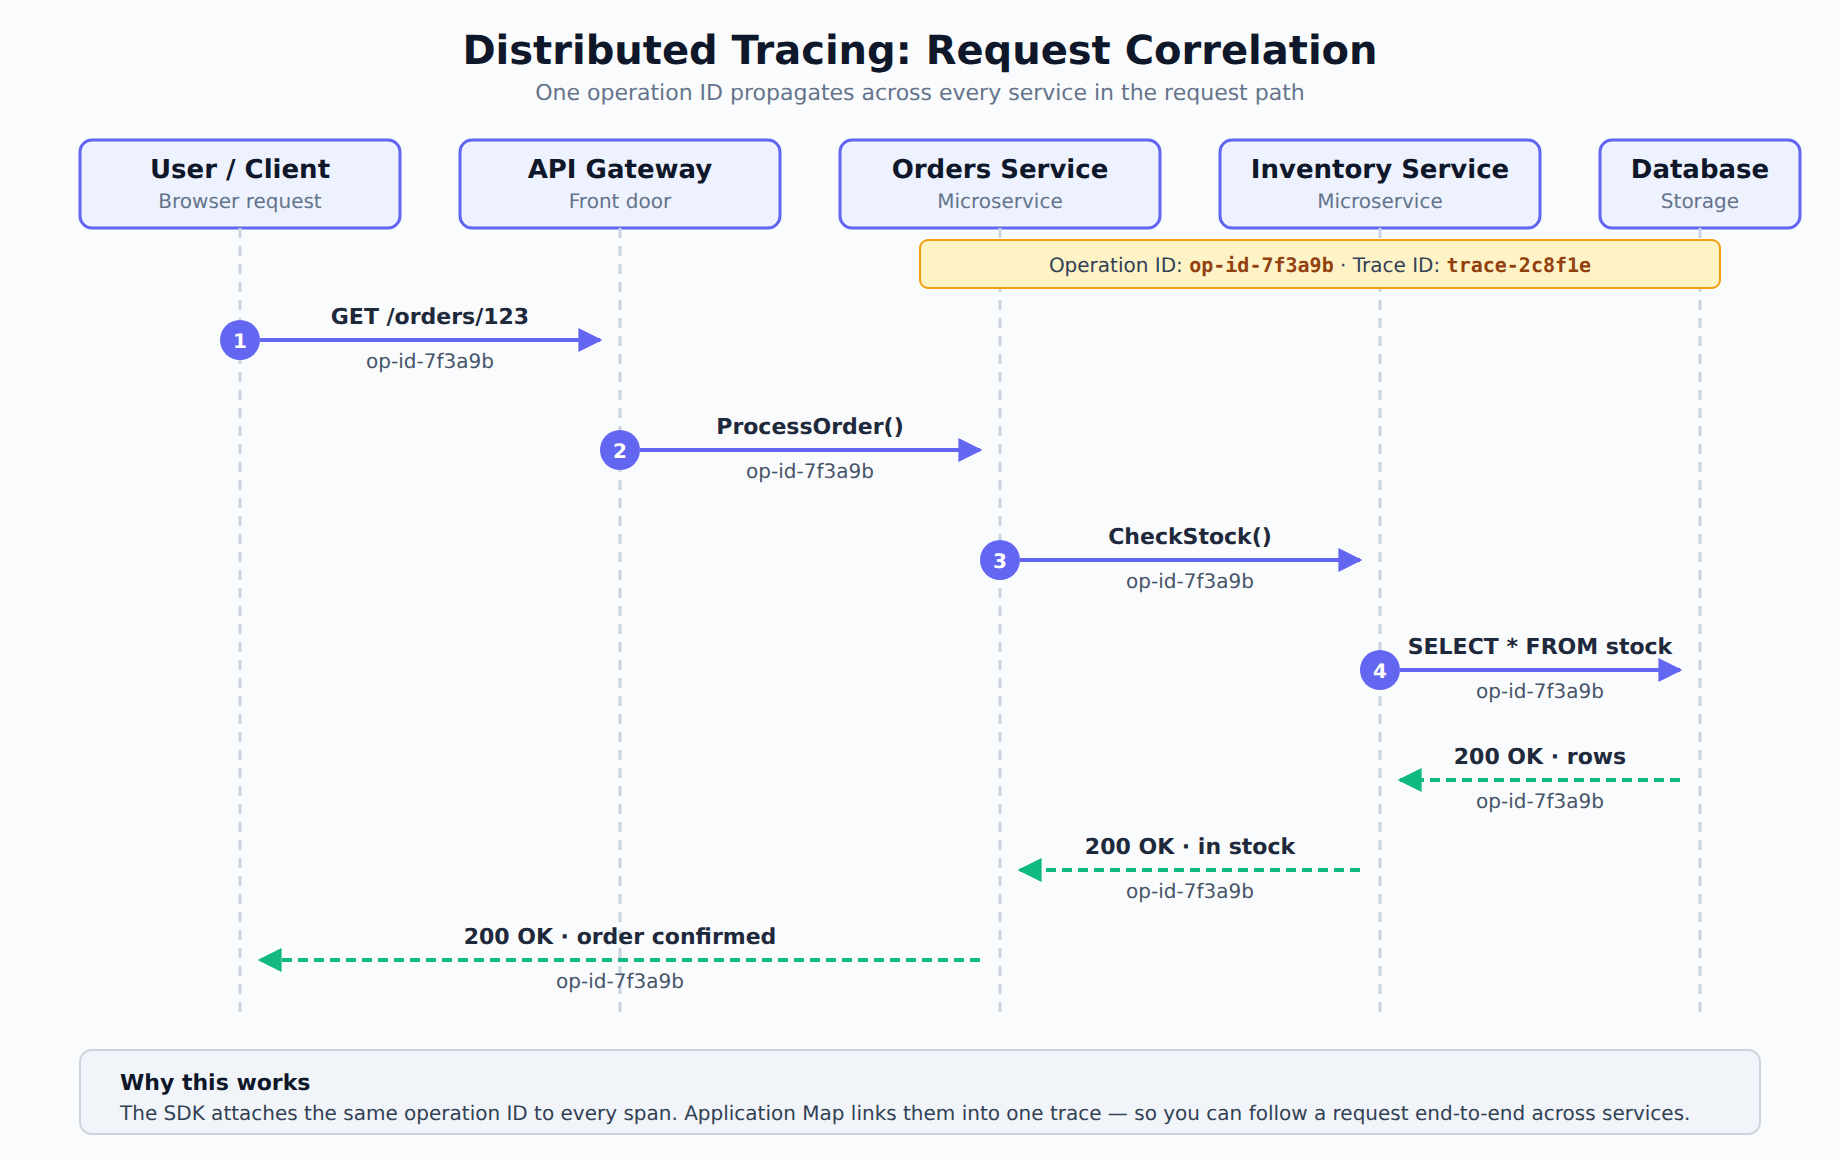
A sequence diagram showing a user request flowing through API Gateway, Orders Service, Inventory Service, and Database, with the same operation ID propagating across each service-to-service call and response.
After the SDK is in place, the Application Map in Application Insights provides a visual display of how the services in your system interact. This map shows dependencies between components and lets you reconstruct the exact path a request follows. By examining trace spans—each span represents a unit of work—you can see where the request traveled and which service handled which step. This view makes it easy to spot bottlenecks or unexpected service calls. The map highlights where bottlenecks or failures are happening, making it easier to identify which part of your application needs attention.
Detailed telemetry analysis focuses on finding the source of latency and understanding how errors spread through the system. The collected telemetry includes trace logs: messages such as debug and info logs that act as breadcrumbs, showing what the application was doing at a specific point in time. It also includes custom events and metrics: manually instrumented data points that highlight significant operations or unusual behavior. Reviewing trace logs helps during investigations because it adds context around errors, such as what operations were running when a failure occurred. By understanding these relationships, you can trace a problem back to its root cause rather than just treating the symptoms.
To get the most value from distributed tracing, collect Information-level logs in production so that enough context is available without overwhelming storage. Ensure each log message carries a contextual identifier, such as the operation ID, which Application Insights attaches automatically. Following these practices gives the team deep visibility into the health and performance of distributed applications and makes it easier to diagnose issues quickly. The operation ID serves as the thread that connects all the pieces of a single request together, no matter how many services it touches.
When analyzing telemetry and logs in Azure, engineers query data stored within Azure Data Explorer using the Kusto Query Language (KQL). The Azure Data Explorer web UI provides a powerful query editor designed to streamline query creation, offering real-time assistance through features like autocomplete and inline troubleshooting. This environment accelerates the process of identifying system anomalies and verifying resource health during DevOps operations.
The query editor includes KQL Intellisense to provide contextual recommendations as you write queries. This assistant suggests functions, operators, and database tables, allowing you to build queries quickly without memorizing exact syntax. When typing in the editor, users can interact with these features through a structured workflow: begin typing the query in the editor to trigger suggestions automatically, navigate the dropdown list of suggestions using the keyboard arrow keys and press Enter or click to select an item, and review underlined keywords to identify syntax errors, or hover over them to view detailed warnings. This makes learning KQL much easier for beginners.
To minimize context-switching, the query editor displays documentation directly inside the interface. Users can hover over any operator or function and click the right arrow icon to open an inline preview of the official documentation, which remains visible until manually closed. Additionally, when the editor detects warnings or suboptimal code, it suggests automated quick fix options. To apply a quick fix, hover over the flagged term, select the Quick Fix menu, and choose the desired optimization, such as converting inline functions or extracting values into variables. These features help you write correct queries without constantly referring to external documentation.
The KQL tools menu in the editor toolbar provides essential management features for organizing your workspace. From this menu, users can duplicate existing queries, trigger the command palette, or link out to comprehensive external learning resources. These tools help manage query versions and settings without disrupting the troubleshooting flow. Having these tools readily available makes it easier to experiment with different queries and compare results.
Querying log data effectively relies on chaining together specific KQL operators that transform raw inputs into structured insights. Data flows from the source table through these operators in a pipeline, where each step modifies the dataset before passing it to the next. The primary operators used to shape this data include: where filters the input table to include only rows that satisfy a specific True or False condition, project selects the specific columns to include, rename, or drop from the final output, summarize groups rows together based on shared values and aggregates data to produce metrics like counts or averages, and extend computes new columns based on calculations or string manipulations and appends them to the active dataset. By combining these operators, you can filter, reshape, and summarize your log data to find exactly the information you need.
Azure Monitor collects data on CPU, memory, disk, and network usage from Azure resources like virtual machines, databases, and app services. These metrics help identify issues like high server load, memory leaks, storage bottlenecks, and network congestion. Azure Monitor stores this data as time-series metrics and logs for historical analysis.
Application Insights Profiler captures detailed performance traces from a running application and links them to infrastructure metrics. For example, it can show that a spike in CPU usage corresponds to a specific method call in your code. Its Code Optimizations feature then analyzes those traces and suggests fixes like rewriting a slow database query.
Application Insights collects server-side telemetry like HTTP requests, external service calls, exceptions, and performance measurements. It also gathers client-side telemetry including uncaught browser exceptions, webpage network requests, and user session information. This combined view shows the full picture of application performance from the user's perspective.
The core KQL operators for log analysis are where, project, summarize, and extend. The where operator filters rows based on a condition, project selects specific columns, summarize groups rows and aggregates data, and extend computes new columns. By chaining these operators, you can filter, reshape, and summarize log data to find needed information.
 StudyCerts
 StudyCerts