Intermediate
Prepare and test your skills
Intermediate
Prepare and test your skills
Isolating GKE Service Mesh Faults with Observability
Free sample question, answered and explained below. The Professional Cloud Architect practice bank has 2,335 more like it. Try 10 free: instant score, no account.
An e-commerce platform running a microservices architecture on Google Kubernetes Engine (GKE) with Cloud Service Mesh experiences intermittent HTTP 500 errors and latency spikes during peak shopping periods.
The operations team must determine whether the failures originate from proxy routing issues or unhandled application code exceptions, while also identifying latency bottlenecks across downstream microservice calls.
Which systematic diagnostic procedure should the team use to isolate the root cause?
Explanations
Restart the istio-ingressgateway pods to clear connection pools and check Kubernetes node-level system logs to isolate microservice application exceptions
Restart the istio-ingressgateway pods to clear connection pools and check Kubernetes node-level system logs to isolate microservice application exceptions
What restarting ingress gateways and checking node logs does
Restarting the istio-ingressgateway deployment tears down active gateway pods and terminates existing TCP connections and client pools. Inspecting Kubernetes node system logs (such as kubelet, containerd, or OS journal logs) provides information regarding operating system events, node resource pressure, and container lifecycle events.
Why it doesn't meet the requirement
- Destructive and Non-Diagnostic: Blindly restarting ingress gateways disrupts active client connections, temporarily masks intermittent issues, and destroys transient memory state without capturing diagnostic evidence.
- Irrelevant Log Scope: Node-level system logs track infrastructure daemons (
kubelet,dockerd/containerd). They do not capture container-levelstdout/stderrapplication exceptions, HTTP response codes, or proxy routing metadata. - Lacks Distributed Tracing: Node logs have no visibility into distributed microservice call graphs or inter-service latency bottlenecks.
Key characteristics and limitations
- Gateway pod restarts only reset proxy connections and do not address underlying code bugs or routing misconfigurations.
- Node logs capture kernel events, disk I/O errors, and container runtime crashes, not application logic errors.
- Distributed request tracing cannot be reconstructed from raw Linux system logs.
This answer would be correct if
The cluster were suffering from an unresponsive Kubernetes node operating system or node-level container runtime failure preventing pods from scheduling.
Additional context
Troubleshooting best practices dictate gathering observability data (logs, traces, error reports) before executing remediation actions like pod restarts, which destroy ephemeral diagnostic state.
Inspect Envoy proxy access logs in Cloud Logging for RESPONSE_FLAGS and RESPONSE_CODE, review aggregated stack traces in Error Reporting, and evaluate round-trip request spans in Cloud Trace
Inspect Envoy proxy access logs in Cloud Logging for RESPONSE_FLAGS and RESPONSE_CODE, review aggregated stack traces in Error Reporting, and evaluate round-trip request spans in Cloud Trace
What the integrated Google Cloud Observability suite is
Google Cloud Observability—encompassing Cloud Logging, Cloud Trace, and Error Reporting—provides a unified telemetry framework designed to diagnose distributed systems. In service mesh environments, sidecar and ingress proxies generate structured access logs, application runtimes report exceptions, and distributed tracing tracks RPC latencies across microservice boundaries.
How it meets the diagnostic requirements
- Distinguishing proxy vs. application errors: Envoy access logs capture key fields like
RESPONSE_FLAGS(e.g.,UFfor upstream connection failure,UTfor upstream timeout) andRESPONSE_CODE. WhenRESPONSE_FLAGSis empty or unset (-) whileRESPONSE_CODEis500, the error originates directly from the backend application rather than proxy-level routing. - Isolating application code exceptions: Error Reporting automatically aggregates application crash stack traces and unhandled exceptions, allowing developers to pinpoint buggy lines of code without manually sifting through raw text logs.
- Identifying latency bottlenecks: Cloud Trace profiles end-to-end request flows across service boundaries, breaking down the round-trip time spent in each downstream microservice.
Trace Timeline: Finding the Slow Microservice
Timeline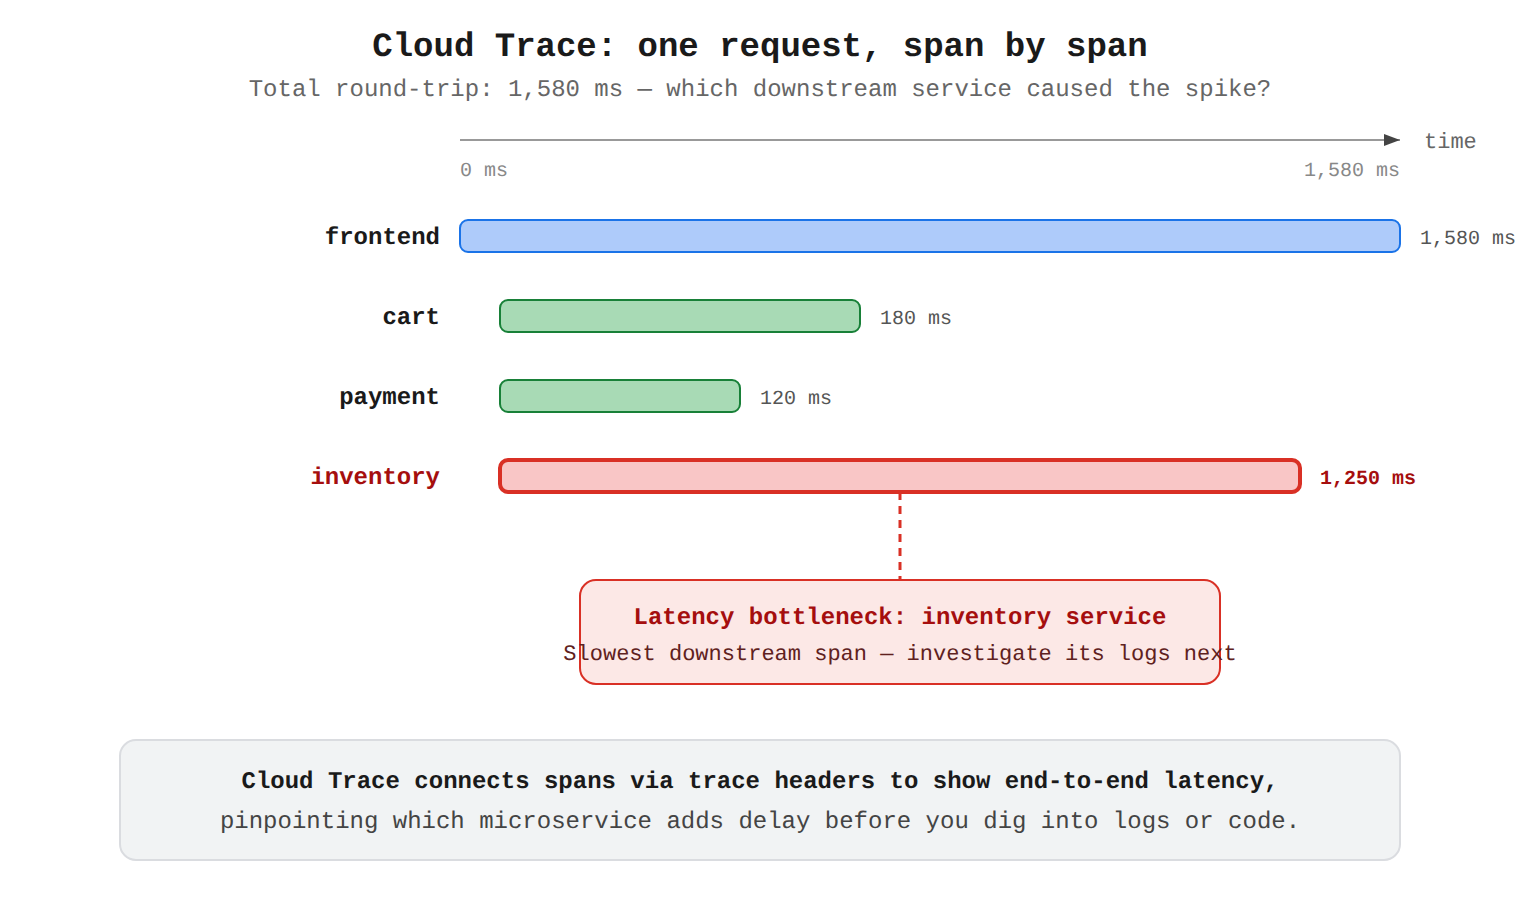
Key advantages and capabilities
- Fast Root Cause Isolation: Directly differentiates transport/proxy issues from internal application faults using standardized log attributes.
- Distributed Context: Connects distributed spans via trace headers to visualize end-to-end transaction latency.
- Automated Triage: Groups duplicate runtime errors into unified incident categories with actionable stack traces.
- Native Integration: Seamlessly captures telemetry generated by Cloud Service Mesh and GKE workloads without custom agents.
Why this is optimal
This multi-tiered observability approach systematically addresses every level of the failure domain—infrastructure and networking at the proxy layer, application logic via error reporting, and inter-service performance via distributed tracing.
Execute istioctl analyze across the cluster namespaces to capture real-time application crash stack traces and create Cloud Monitoring alerting policies to trace inter-service RPC latencies
Execute istioctl analyze across the cluster namespaces to capture real-time application crash stack traces and create Cloud Monitoring alerting policies to trace inter-service RPC latencies
What istioctl analyze and Cloud Monitoring alerting policies do
istioctl analyze is a static configuration diagnostic tool that scans Kubernetes cluster resources and Istio custom resource definitions (CRDs) for structural or semantic errors, such as missing sidecar injection labels, unresolvable gateway hosts, or mismatched destination rules. Cloud Monitoring alerting policies evaluate aggregated numerical metrics against predefined thresholds to send notifications when anomalies occur.
Why it doesn't meet the requirement
- Static vs. Runtime Inspection:
istioctl analyzeevaluates static configuration definitions. It cannot monitor live application runtimes, intercept dynamic traffic, or capture application-level unhandled exceptions and crash stack traces. - No Distributed Tracing: Cloud Monitoring alerting policies notify teams that a metric (such as p99 latency) has breached a target, but they cannot trace individual RPC calls or show span-by-span timing across microservice hops.
- Inability to Isolate Proxy vs. Backend Errors: Neither tool inspects individual request
RESPONSE_FLAGSto determine if a specific 500 error was generated by the proxy layer or the backend pod.
Key characteristics and limitations
istioctl analyzefinds misconfigurations before or during deployments (e.g., misconfigured route rules).- Cloud Monitoring alerts are reactive signals rather than granular root-cause investigation tools.
- Application crash stack traces are processed by Error Reporting, not
istioctl.
This answer would be correct if
The goal was to validate whether recent Kubernetes YAML deployment manifests contained syntax errors or mismatched Istio CRD configurations prior to routing production traffic.
Additional context
While istioctl analyze is useful during initial deployment troubleshooting, live troubleshooting of 5xx errors requires dynamic telemetry (logs, traces, and exception aggregations).
Enable VPC Flow Logs on all subnetworks to inspect HTTP request payloads and use the Cloud Monitoring Metrics Management page to trace distributed microservice calls
Enable VPC Flow Logs on all subnetworks to inspect HTTP request payloads and use the Cloud Monitoring Metrics Management page to trace distributed microservice calls
What VPC Flow Logs and Metrics Management do
VPC Flow Logs record network flow samples for TCP and UDP traffic traversing network interfaces within Google Cloud Virtual Private Cloud (VPC) subnets, capturing metadata such as source IP, destination IP, port, and packet counts. The Cloud Monitoring Metrics Management page is a cost-governance tool designed to analyze ingestion volumes, metric cardinality, and billing costs for user-defined and system metrics.
Why it doesn't meet the requirement
- Layer 4 vs. Layer 7: VPC Flow Logs operate exclusively at the network transport layer (Layer 4). They do not inspect application-layer payloads, HTTP status codes, or
RESPONSE_FLAGS, making it impossible to detect HTTP 500 application errors. - No Application Exception Visibility: VPC Flow Logs do not capture application stack traces or error logs.
- Misaligned Metric Tool: The Metrics Management interface manages observability expenditure and cardinality; it does not provide distributed request tracing or span analysis across microservices.
Key characteristics and limitations
- VPC Flow Logs provide low-level network telemetry (IP, port, bytes, packets).
- VPC Flow Logs omit application headers, HTTP response bodies, and Envoy proxy status flags.
- The Metrics Management page helps identify high-cost or high-cardinality metrics to optimize ingestion budgets.
This answer would be correct if
The primary requirement was auditing network egress volume, debugging subnetwork routing tables, or reducing Cloud Monitoring ingestion costs.
Additional context
Tracing distributed microservices requires context propagation (like W3C traceparent headers) evaluated in Cloud Trace, which operates at Layer 7 rather than the VPC subnetwork packet level.
Try 10 interactive questions like this one, free
Answer them yourself and get your score the moment you finish. No account needed.
Full access includes
- 2,335 practice questions across all 6 exam domains
- Every answer explained: why it is right, and why the others are not
- Scout, an AI tutor that answers your follow-up questions
- Readiness tracking by domain, so you know when to book the exam
Related questions
Keep the momentum going with these hand-picked practice scenarios
IntermediateProfessional Cloud Architect
Network Intelligence Center Connectivity Tests
Troubleshooting/root cause analysis best practices
IntermediateProfessional Cloud Architect
Blameless Post-Mortem
Troubleshooting/root cause analysis best practices
IntermediateProfessional Cloud Architect
Weighted Backend Services
Application and infrastructure deployment
IntermediateProfessional Cloud Architect
GKE Workload Identity and Network Policies
Container orchestration
IntermediateProfessional Cloud Architect
Cloud Audit Logs Types and Private Logs Viewer
Audits (including logs)
AdvancedProfessional Cloud Security Engineer
HA VPN over Cloud Interconnect IPsec Internal Addresses
Designing and configuring private connectivity and encryption between data centers and VPC network (e.g., HA VPN, Cloud Interconnect).
Last updated