Intermediate
Prepare and test your skills
Intermediate
Prepare and test your skills
GKE Usage Metering for Team Cost Attribution
Free sample question, answered and explained below. The Professional Cloud Architect practice bank has 2,335 more like it. Try 10 free: instant score, no account.
An enterprise has migrated multiple line-of-business applications onto shared, multi-tenant Google Kubernetes Engine (GKE) clusters. Executive leadership requires the cloud architecture team to establish a value realization framework to evaluate return on investment (ROI) and platform adoption.
The framework must satisfy the following business requirements:
- Accurately attribute cloud resource consumption and compute costs to specific business units and application teams.
- Compare requested resource allocations against actual workload utilization to identify over-provisioning and financial waste.
- Provide business stakeholders with customizable visual dashboards for long-term tracking of key performance indicators (KPIs).
Which solution should the cloud architect implement to track these value realization metrics?
Explanations
Install the Ops Agent on all underlying Compute Engine cluster nodes to ingest operating system memory and disk metrics into Cloud Logging
Install the Ops Agent on all underlying Compute Engine cluster nodes to ingest operating system memory and disk metrics into Cloud Logging
What the Ops Agent Does
The Ops Agent runs inside Compute Engine virtual machines to collect host-level telemetry, such as OS memory usage, disk IOPS, swap usage, and system logs, forwarding them to Cloud Monitoring and Cloud Logging.
Why It Doesn't Meet the Requirement
- Lacks pod and namespace granularity: The Ops Agent operates at the virtual machine host level. It cannot distinguish between multiple containerized tenants or namespaces collocated on the same VM node.
- Fails cost attribution: Capturing raw host metrics inside Cloud Logging does not associate consumption with business units or calculate workload financial efficiency.
- Unsuitable visualization workflow: Cloud Logging is designed for log inspection, filtering, and troubleshooting rather than dynamic, multi-tenant KPI dashboarding.
Key Characteristics and Limitations
- Host-centric: Gathers VM-level metrics and system logs rather than container orchestration metadata.
- Inefficient for ROI calculations: Log entries require custom parsing and ingestion pipelines to derive structured time-series metrics.
This Answer Would Be Correct If
The objective were capturing detailed Linux kernel logs and low-level disk I/O metrics directly from standalone Compute Engine virtual machines.
Enable GKE usage metering with breakdown by namespaces and labels, export the usage data to BigQuery, and build analytical KPI dashboards in Looker Studio
Enable GKE usage metering with breakdown by namespaces and labels, export the usage data to BigQuery, and build analytical KPI dashboards in Looker Studio
What GKE Usage Metering and Looker Studio Integration Is
GKE usage metering is a native Google Kubernetes Engine capability that records detailed information about resource requests and actual resource consumption across workloads within a cluster. It exports this granular telemetry directly into BigQuery, enabling deep analytical querying and dashboard visualization via Looker Studio.
GKE Usage Metering to KPI Dashboards
System Architecture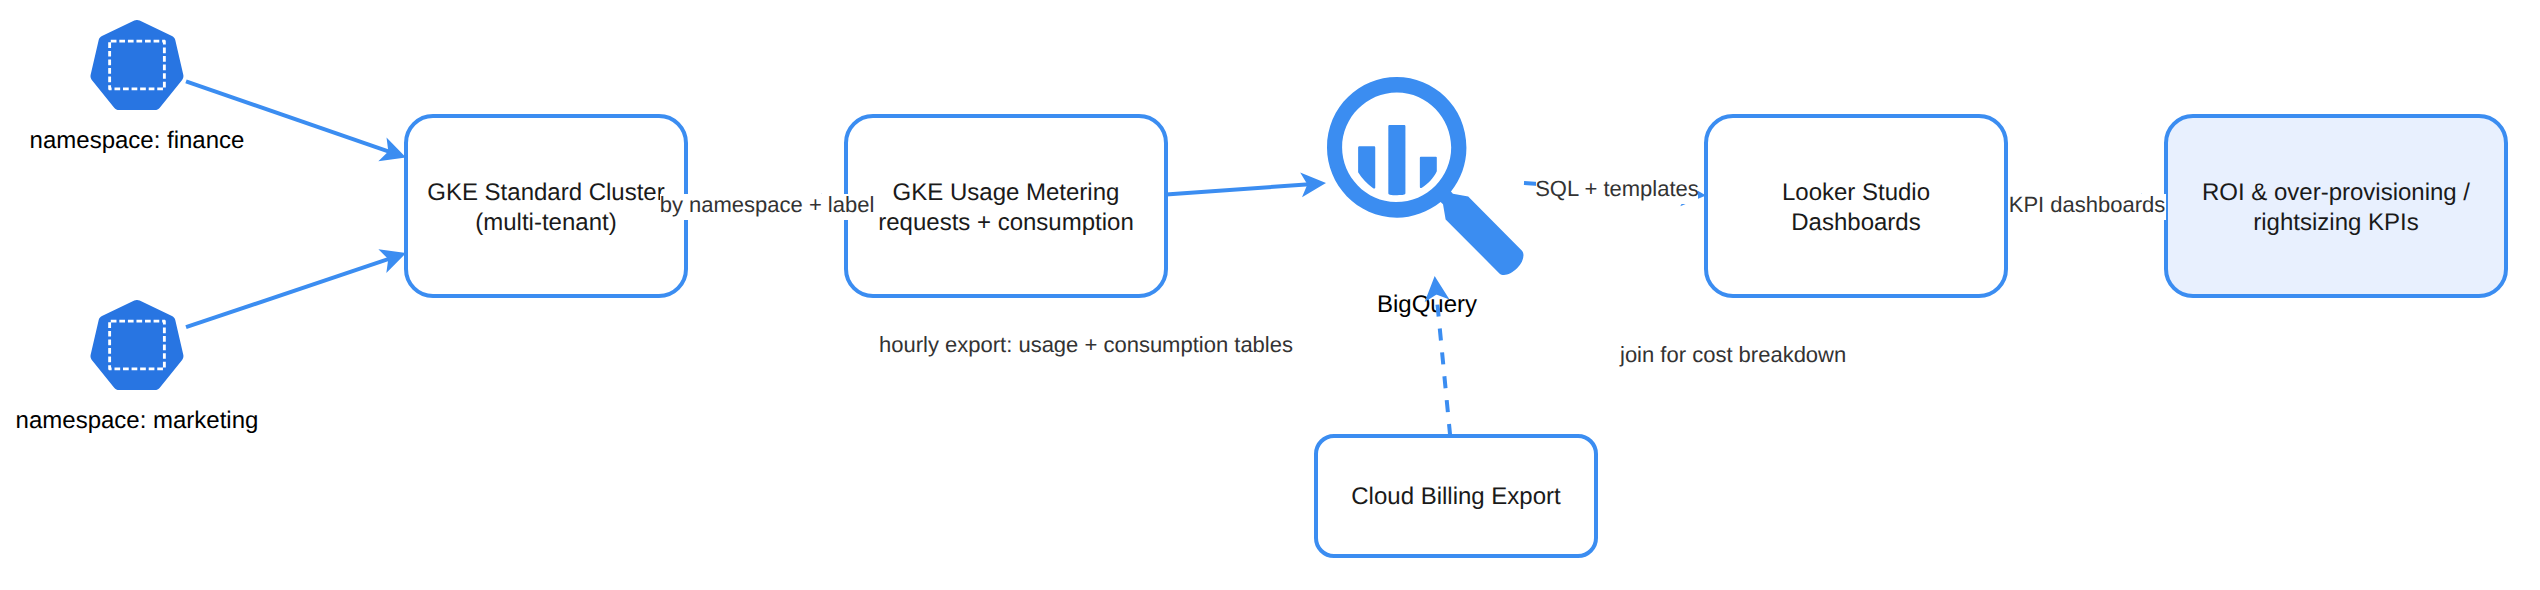
How It Meets Business Requirements
- Cost Attribution and Accountability: Workloads are segmented using Kubernetes namespaces and labels, allowing usage metrics for CPU, memory, GPU, TPU, and storage to be cleanly mapped to distinct business units and development teams.
- Over-provisioning and ROI Analysis: By contrasting allocated resource requests against actual consumption over time, platform leaders can pinpoint underutilized services, eliminate infrastructure waste, and evaluate accurate workload unit economics.
- Stakeholder Dashboards: Exporting data to BigQuery unlocks custom SQL analytics and connects natively with Looker Studio templates, delivering high-level KPI trends and long-term financial reporting to executives.
Key Advantages and Capabilities
- Granular multi-tenant visibility: Differentiates infrastructure usage per tenant without requiring separate physical clusters.
- Direct BigQuery integration: Bypasses short-term metric retention limits, storing historical records for multi-quarter trend and ROI analysis.
- Customizable visualization: Leverages pre-built or custom Looker Studio dashboards to bridge technical operations and business value.
- Actionable rightsizing: Direct comparison between requests and actual consumption provides clear guidance for adjusting pod specs.
Why This Is Optimal
This approach directly aligns technical workload metrics with organizational accounting structures. Rather than relying on simple infrastructure monitoring, it gives business leaders and architects the continuous operational and financial transparency necessary to realize and maximize cloud investment value.
Configure Cloud Monitoring threshold alerting policies to notify engineering leads when cluster node CPU utilization exceeds 80%
Configure Cloud Monitoring threshold alerting policies to notify engineering leads when cluster node CPU utilization exceeds 80%
What Cloud Monitoring Alerting Is
Cloud Monitoring alerting policies evaluate real-time metric streams against predefined thresholds and notify designated responders via channels such as email, Slack, or PagerDuty when anomalies or resource constraints occur.
Why It Doesn't Meet the Requirement
- No cost attribution: Node-level CPU alerts provide raw operational health signals but cannot attribute resource consumption to specific business units or application teams sharing the node.
- Lacks ROI and efficiency metrics: Alerting when a VM exceeds 80% CPU utilization does not analyze whether individual application pods are over-requesting memory or CPU relative to their actual usage.
- Operational rather than strategic: Alerting policies handle transient operational incidents rather than tracking long-term business value realization or executive KPI trends.
Key Characteristics and Limitations
- Incident-focused: Designed for rapid incident response and tactical system remediation.
- Node-level aggregation: Lacks native Kubernetes namespace and tenant awareness for granular cost breakdown.
- Short-term horizon: Focuses on immediate threshold violations rather than longitudinal business metrics.
This Answer Would Be Correct If
The primary requirement were establishing an operational escalation mechanism to warn on-call engineers of impending capacity exhaustion on cluster nodes.
Deploy open-source Prometheus and Grafana from Google Cloud Marketplace to monitor cluster-level cAdvisor and Kubelet operational metrics
Deploy open-source Prometheus and Grafana from Google Cloud Marketplace to monitor cluster-level cAdvisor and Kubelet operational metrics
What Marketplace Prometheus and Grafana Do
Prometheus and Grafana deployed from Cloud Marketplace provide a self-managed, open-source stack for scraping, storing, and visualizing real-time container and node telemetry such as cAdvisor and Kubelet statistics.
Why It Doesn't Meet the Requirement
- No financial or cost data modeling: While Prometheus captures real-time technical usage counters, it does not correlate Kubernetes usage directly with Google Cloud billing and financial cost structures for chargeback.
- Operational focus: Standard Grafana dashboards provide short-term cluster telemetry rather than long-term business outcome tracking and executive KPI modeling.
- Management overhead: Self-hosting the time-series database requires ongoing maintenance, disk management, and data retention tuning compared to serverless BigQuery exports.
Key Characteristics and Limitations
- Short-to-medium metric retention: Prometheus is primarily optimized for low-latency operational querying rather than multi-year analytical reporting.
- Lacks enterprise billing integration: Does not natively map workload consumption back to GCP organizational billing accounts without external specialized tooling.
This Answer Would Be Correct If
The goal were to give DevOps engineers a familiar open-source monitoring interface for debugging real-time pod memory leaks and node scheduling events.
Try 10 interactive questions like this one, free
Answer them yourself and get your score the moment you finish. No account needed.
Full access includes
- 2,335 practice questions across all 6 exam domains
- Every answer explained: why it is right, and why the others are not
- Scout, an AI tutor that answers your follow-up questions
- Readiness tracking by domain, so you know when to book the exam
Related questions
Keep the momentum going with these hand-picked practice scenarios
IntermediateProfessional Cloud Architect
Cloud Monitoring and Active Assist
Customer success management
IntermediateProfessional Cloud Architect
Google Cloud Technical Account Advisor Service
Customer success management
IntermediateProfessional Cloud Architect
Cloud Spanner Global ACID Relational Database
Choosing appropriate storage types (e.g., object, file, and databases)
IntermediateProfessional Cloud Architect
Cloud DNS Failover Routing Policy
Business continuity plan
IntermediateProfessional Cloud Architect
Gemini Cloud Assist Security Command Center Enterprise
Gemini Cloud Assist
AdvancedProfessional Cloud DevOps Engineer
Spark Dynamic Allocation Cached Executor Idle Timeout
Infrastructure issues
Last updated