Fundamental
Prepare and test your skills
Fundamental
Prepare and test your skills
Making Data Useful with Analytics and BI
Discuss how smart analytics, business intelligence tools, and streaming analytics can add value in different business use cases.
Smart analytics, business intelligence tools, and streaming analytics add business value by turning raw data into timely decisions, consistent reports, and immediate actions. Smart analytics finds patterns in large datasets, business intelligence shares those patterns as trusted visuals, and streaming analytics acts on events as they happen. Together they help businesses optimize operations, forecast outcomes, and respond in seconds.
Smart Analytics with BigQuery and Predictive Modeling
Smart analytics on Google Cloud centers on BigQuery (opens in a new tab) as a fully managed, serverless data warehouse with no infrastructure to manage. BigQuery separates storage from compute so each side scales independently over a petabit-scale network. The storage layer keeps data in columnar format with automatic replication across locations, while the compute layer runs distributed queries without slowing ingestion. BigQuery can query terabytes in seconds and petabytes in minutes and accepts batch loads, automated transfers, and continuous streaming inserts.
Analysis happens where the data lives using ANSI-standard SQL, Python with BigQuery DataFrames, geospatial functions, and federated queries to Cloud Storage, Bigtable, Spanner, or Google Sheets. BigQuery ML builds and trains machine learning models with SQL directly inside the warehouse, so data flows from tables into training and the trained model scores new rows without moving data. Common patterns include dashboards and repeatable reporting, ad hoc exploration, geospatial decisions, and forecasting demand or customer behavior. Governance with Identity and Access Management (IAM), lineage, data quality, and Knowledge Catalog keeps this analysis trusted.
Governed Business Intelligence for Reporting and Planning
Governed business intelligence turns consolidated data into visuals and metrics that every team can trust. Data flows from sales systems, operations databases, and storage into BigQuery, then from BigQuery into Looker for exploration and sharing. Looker applies a unified data model that defines each metric once, while Connected Sheets brings billions of rows into Google Sheets and Looker Studio builds simple charts and reports. Because everyone uses the same definitions, dashboards, scorecards, and scheduled reports show the same numbers.
Business intelligence delivers value in three connected steps. First it consolidates multiple sources into one view so teams stop checking systems separately. Then it visualizes trends with line charts for change over time and bar charts for comparison, so rising sales or falling performance is easy to spot. Finally it communicates performance metrics such as revenue, cost, and satisfaction through dashboards for daily monitoring and shared reports for strategic planning.
Exam tip: Choose Looker when the need is governed, advanced analytics with a shared metric model, and choose Looker Studio when the need is simple charts, reports, and dashboards.
Streaming Analytics for Immediate Operations
Streaming analytics captures and processes event data as it arrives instead of waiting for batch jobs. Data flows from apps, websites, servers, and sensors to Pub/Sub for capture, from Pub/Sub to Dataflow for processing, and from Dataflow to BigQuery, Bigtable, and Cloud Storage for immediate use. Pub/Sub is asynchronous messaging with about 100 milliseconds latency, where publishers send to a topic and subscribers receive independently. Dataflow is unified stream and batch processing that filters, aggregates, enriches, and runs machine learning inference, with exactly-once processing by default.
Pub/Sub to BigQuery Streaming Pipeline
Process FlowA left-to-right process flow showing event sources publishing to Pub/Sub for ingest, Dataflow for transform, and BigQuery for storage and real-time analysis.
Immediate insight changes operations because action happens while the event is still relevant:
- Fraud detection flags unusual payment patterns as transactions occur
- User engagement updates recommendations while users are still active
- System monitoring refreshes dashboards and alerts from logs and sensor data to detect failures quickly
Describe how Looker democratizes access to data by empowering individuals to self-serve business intelligence and create insights.
Self-serve business intelligence in Looker (opens in a new tab) means non-technical users can ask questions and build visuals without writing SQL, while results stay consistent. Looker places a centralized semantic layer called LookML between users and the database, so business rules are defined once and reused everywhere. Every Explore, Look, and dashboard flows through those shared definitions to live data.
Single Source of Truth with LookML Models and Views
LookML is the semantic modeling language that creates a single source of truth for all queries. A LookML project lives in its own Git repository and defines the database connection, table relationships, and options that appear in the user interface. A model controls which tables can be queried together and how joins behave, a view controls how columns become dimensions and measures, and an Explore combines a model and views into a starting point for questions. A manifest file handles imported files and localization.
The dependency chain keeps results accurate. The Explore depends on the model for join paths, the model depends on the database connection for access, and the Explore depends on views for field definitions. When a user builds a question, Looker combines join logic with field definitions to generate SQL and sends it to the database. Looks and dashboards contain no LookML of their own, so they also rely on the same shared elements.
Exam tip: Define a metric once as a measure in a view, not separately in each dashboard, so every Look and dashboard that uses that view returns the same result.
Self-Service Exploration with Conversational Analytics
Self-service exploration lets users select fields, filters, sorts, and limits in an Explore while Looker writes the SQL. The user never specifies joins, because the model supplies relationships, filters, aggregations, and permissions. For example, a count of orders grouped by state uses model logic to join orders to users on orders.user_id = users.id, apply the date filter, group, sort, and limit rows. Conversational Analytics extends this with natural-language questions powered by Gemini for Google Cloud, using the semantic model as truth and mapping words to fields with LookML name, label, description, type, and value_format.
Looker offers two conversational agent types with different scope and sharing:
| Agent type | Scope of analysis | Sharing boundary |
|---|---|---|
| Agents | Specialized assistant for cross-domain work across up to five connected Explores, with instructions, glossaries, and Python execution if enabled | Shared with View or Manager access and publishable to Gemini Enterprise, but sharing does not grant Explore access |
| Dashboard agents | Assistant limited to one dashboard and its query-linked tiles | Inherits the dashboard sharing model and cannot be shared independently |
Live In-Database Queries That Become Actions
Live in-database access means every question becomes SQL that runs directly against the connected database at query time. Data flows from database tables to the Looker query engine to results and visualizations, so answers reflect current data rather than a stale extract. The flow follows a fixed order: first the user or agent defines fields, filters, sorts, and limits, then Looker composes complete SQL with FROM, LEFT JOIN, WHERE, GROUP BY, ORDER BY, and LIMIT, then the database executes it and Looker returns the result. SQL Runner shows this path by running hand-written SQL, showing up to 5,000 rows, and highlighting the first error.
Governed insights can then move into workflows without copying logic. Standalone analytics agents carry the same LookML definitions and permissions into tools like Gemini Enterprise, while dashboard agents support work tied to a specific dashboard. Sharing an agent never grants data access, because each user still needs access_data and model permissions on the underlying Explores to see live results.
Discuss the value of analyzing and visualizing data from BigQuery in Looker to create real-time reports, dashboards, and integrating data into workflows.
The combined value of BigQuery (opens in a new tab) and Looker (opens in a new tab) comes from dividing work between fast storage and trusted presentation. BigQuery stores and queries very large datasets with a serverless engine, while Looker connects directly to that live data and turns results into reports, dashboards, and embedded experiences. Data flows from BigQuery tables through shared model definitions to visualizations, so teams see timely insights without a separate reporting database.
Reports and Dashboards Built on a Shared Model
Reports and dashboards in Looker are interactive visuals built on a shared LookML definition. A data expert first describes tables, fields, joins, and business rules in LookML, then business users select fields in an Explore and Looker generates correct SQL automatically. Results return as charts, tables, and dashboards that can be shared across teams and reused in data applications. Looker is platform independent and hosted in Google Cloud, connecting to BigQuery as well as Snowflake, Redshift, Oracle, MySQL, and other clouds, so all sources flow through the same modeling layer to one surface.
Exam tip: BigQuery works on its own for storage and analysis, while Looker is added when you need business intelligence, data applications, or embedded analytics on top of that data.
Embedded Analytics and Faster Dashboard Performance
Embedded analytics brings live BigQuery insights into the applications where people already work. Data flows from BigQuery tables through Looker queries into portals and custom experiences, so teams act without exporting files or switching tools. Consistent LookML models reduce manual effort because logic defined once is reused for every report with speed and accuracy. BI Engine, the in-memory acceleration layer, speeds interactive queries when Looker connects to a BI Engine-enabled project, which keeps operational dashboards current. That connection depends on a service account that uses the same billing project as the BI Engine reservation.
System Activity closes the loop by monitoring how content performs. After Looker connects to BigQuery, System Activity generates usage reports and analyzes query performance against BigQuery-specific metrics, including BI Engine metrics. Data flows from BigQuery to Looker through the connection, then performance data flows back into System Activity for review, which helps administrators spot heavy queries and keep workflows reliable.
Real-Time Flow from Stored Data to Visual Decisions
The real-time flow moves from stored data to visual support in a fixed order accelerated by BI Engine:
- Data lands in BigQuery: Streaming ingestion and batch loads place rows into tables where columnar storage keeps scans fast.
- LookML defines query logic: A data expert maps datasets, tables, and business definitions into reusable Explores.
- User explores in Looker: Selections in an Explore or dashboard become a SQL query for BigQuery.
- BigQuery and BI Engine return fresh results: The query runs, BI Engine accelerates the response, and data flows back to Looker for charts and shared dashboards.
BigQuery and Looker have complementary roles with a one-way query dependency. BigQuery owns ingestion, replicated columnar storage, large-scale SQL and Python, BigQuery ML, and geospatial analysis. Looker owns consistent definitions, exploration, sharing, and embedding. Choose BigQuery alone for loading, storing, and querying large datasets, and choose BigQuery with Looker when many people need the same trusted definitions, visual exploration, or analytics inside another application.
Real-time streaming analytics makes data more useful by shrinking the gap between a source change and an insight or action. Instead of waiting for batch updates, continuous flows stay visible within seconds for fraud detection, personalization, and operations. On Google Cloud this value comes from Pub/Sub and Dataflow for event pipelines and Datastream (opens in a new tab) for database replication into BigQuery (opens in a new tab) and Cloud Storage.
Event Pipeline from Pub/Sub Through Dataflow to BigQuery
The event pipeline is a fixed three-stage path where each service depends on the previous output. Pub/Sub ingests and distributes events, Dataflow transforms and enriches them, and BigQuery stores them for SQL, dashboards, and machine learning. Pub/Sub decouples publishers from subscribers, so many producers can send game logs, sensor data, and transactions without waiting, while Pub/Sub buffers bursts. Dataflow uses the same Apache Beam model for stream and batch, written in Java, Python, or Go, and runs with low latency for ETL into BigQuery, dashboard backends, real-time inference, and log processing.
The ordered flow is:
- Ingest in Pub/Sub: Publishers send JSON events to a topic, and Pub/Sub holds them for delivery to a subscription.
- Process in Dataflow: A streaming job reads the subscription, cleans, aggregates, enriches, or scores data, optionally with user-defined functions (UDFs), and autoscales worker virtual machines (VMs) to match volume.
- Store and analyze in BigQuery: Transformed rows land in tables with a schema, ready for alerts, dashboards, and decisions.
Dataflow provides exactly-once processing by default, with at-least-once mode when duplicates can be tolerated to reduce cost and improve latency. Monitoring in the Dataflow interface shows progress per stage to reveal bottlenecks.
Exam tip: Choose a direct Pub/Sub BigQuery subscription with a UDF for simple delivery to BigQuery, and choose a Dataflow pipeline when the stream needs complex transforms, joins, or enrichment before loading.
Try the scenario
Choosing a Real-Time Pipeline Architecture on Google Cloud
Change the inputs and watch how the outcome changes.
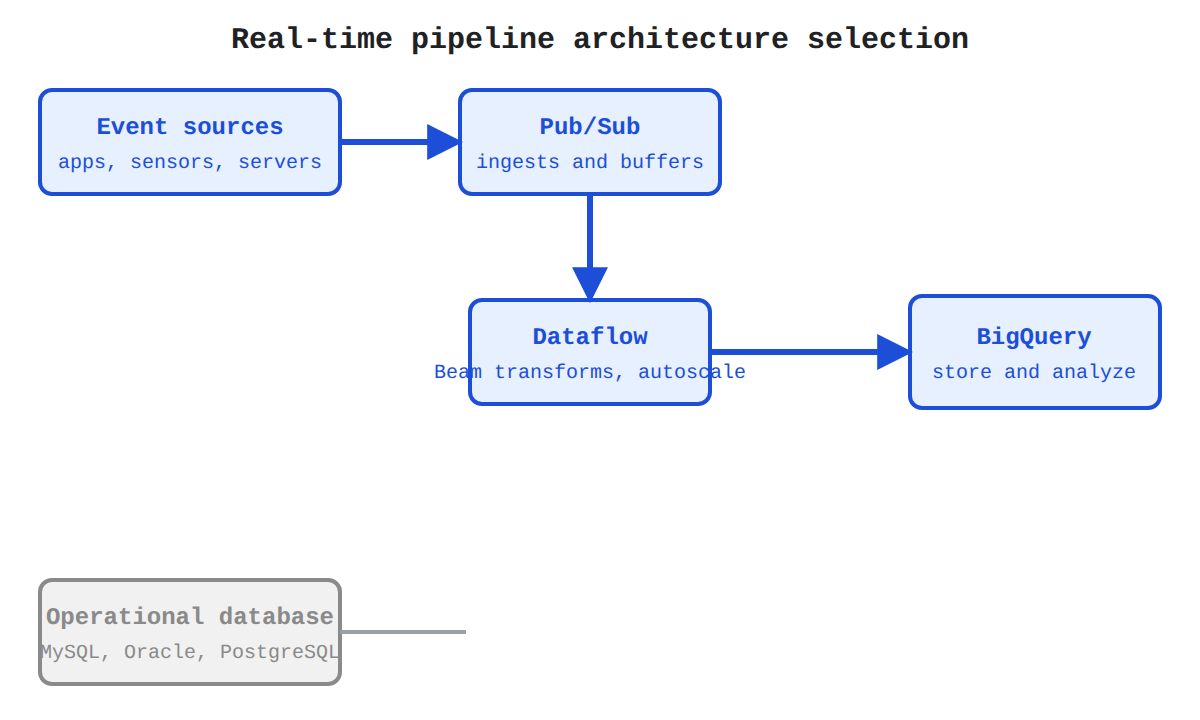
Change the workload source and processing requirement to see which ingestion path fits.
Database Replication with Datastream Change Capture
Datastream creates business value as serverless change data capture (CDC) that synchronizes operational data with minimal latency. Change events flow from source databases and applications into analytics destinations, so teams see current behavior and act immediately. Sources include MySQL, Oracle, PostgreSQL including AlloyDB for PostgreSQL, SQL Server, MongoDB, Spanner, Salesforce, and ServiceNow. Destinations include BigQuery for analysis and Cloud Storage for Avro or JSON event streams, with Dataflow templates loading onward to Spanner and Cloud SQL.
A stream depends on connection profiles that hold source and destination connectivity and on private connectivity configurations that carry traffic over Virtual Private Cloud (VPC) peering. Streams, profiles, and private configurations must be in the same region, which keeps the trust boundary clear between sources, the replication stream, and governed destinations. The Data freshness graph confirms visibility by showing time elapsed since Datastream last checked the source, alongside events processed and failed in the last 7 days.
Low-Latency Business Outcomes and Stream Reliability
Low-latency insights improve decisions because leaders respond to current conditions rather than yesterday's reports. Personalization improves when recent user actions unify quickly into offers and recommendations. Risk drops when fresh data exposes fraud, failures, and performance drops while still small. Optimization improves when analysts join current Datastream and event data with other datasets to adjust pricing, inventory, and staffing. Datastream keeps this flow serverless, scalable, and secure through private connectivity and transparent status.
Reliability depends on lifecycle states and controls. Starting moves a stream from Not started to Starting to Running in about 30 seconds, pausing moves it from Running to Draining to Paused, and resuming returns it to Running. Key controls include historical backfill to copy existing tables before CDC keeps them current, maximum concurrent CDC tasks defaulting to 5 and backfill tasks defaulting to 16, and monitoring for backfills and freshness. If a stream stays paused beyond source retention, it can fail and must be recreated.
Describe the main Google Cloud products that modernize data pipelines, including Pub/Sub and Dataflow.
Modern data pipelines on Google Cloud are modernized by splitting ingestion from processing into two managed stages. Pub/Sub ingests and distributes real-time events from many producers, and Dataflow (opens in a new tab) transforms those events and delivers them to storage and analytics. Publishers send without waiting, Dataflow reads as a source and writes to a destination, and dashboards and warehouses receive continuous updates with low operational effort.
Combined Pipeline from Producers to Analytics Destinations
The combined pipeline moves data end to end in a fixed order from producers through ingestion and transformation to queryable storage:
- Publish: Apps, services, or IoT devices send user interactions, server events, or sensor data to a Pub/Sub topic.
- Buffer and distribute: Pub/Sub holds messages for subscribers so producers do not wait for processing.
- Read and transform: A Dataflow job reads Pub/Sub messages as its streaming source and transforms them in real time or batch with the same Beam logic.
- Write: Dataflow delivers results to BigQuery, Bigtable, and Cloud Storage for queries, dashboards, and machine learning.
Ready-made Dataflow templates for Pub/Sub to Cloud Storage and BigQuery are available in the console, so teams can reuse predefined pipelines without writing Apache Beam code. Pub/Sub handles real-time event distribution, database change replication, and enterprise event bus patterns, while Dataflow supports data movement, ETL into BigQuery, dashboard backends, real-time inference, and sensor or log processing.
Exam tip: Pub/Sub ingests and distributes messages but does not transform them; Dataflow reads from Pub/Sub and performs the transform and delivery to BigQuery, Bigtable, or Cloud Storage.
Pub/Sub for Scalable Asynchronous Ingestion
Pub/Sub is an asynchronous and scalable messaging service where publishers send to a topic and subscribers receive independently. Communication typically happens with latency on the order of 100 milliseconds, which suits streaming analytics that gather events from many clients at once. Unlike synchronous remote procedure calls (RPCs) where sender and receiver must both be available, Pub/Sub lets publishers finish after publishing and lets subscribers process when ready. New subscribers can be added without changing publishers, and one slow subscriber does not stop ingestion.
Per-message parallelism maximizes throughput. Pub/Sub leases individual messages to subscriber clients and tracks success per message, so many subscribers work in parallel. Partition-based systems instead force ordered processing within each partition and limit concurrency to partition count. Multiple instances can share load from a common topic, so if service in one zone fails, others pick up the work automatically. Pub/Sub also connects to automation through push delivery to Cloud Functions, Workflows, and Managed Airflow triggers, with OAuth and Identity and Access Management (IAM) controls per resource.
Dataflow for Unified Stream and Batch Processing
Dataflow is a fully managed service for unified stream and batch processing built on open source Apache Beam. Apache Beam provides windowing, session analysis, and source and sink connectors including BigQuery, and pipelines written in Java, Python, and Go can later run on Flink or Spark without rewriting. The same flow applies every time: the pipeline reads from sources, transforms and enriches data, and writes to a destination. By default Dataflow provides exactly-once processing, while streaming pipelines that tolerate duplicates can use at-least-once mode to reduce cost and improve latency.
Dataflow lowers operations through serverless scaling and flexible development:
- Write code with Beam software development kits (SDKs), run from the command line, or iterate in JupyterLab notebooks
- Deploy a Dataflow template, including Google-provided templates, without knowing Beam programming
- Let the service allocate worker VMs on job start, autoscale by adding or removing VMs, dynamically rebalance work, and delete VMs on completion, with billing for compute used
The Dataflow monitoring interface in the console shows a graphical view of each stage with progress and execution details. Together Pub/Sub buffering plus Dataflow parallel processing and autoscaling absorb spikes, recover independently, and keep delivery reliable without manual resizing.
Key Facts
- BigQuery is a serverless data warehouse that separates storage from compute and can query terabytes in seconds and petabytes in minutes.
- BigQuery ML builds and trains machine learning models with SQL inside the warehouse without moving data to a separate platform.
- Looker uses LookML models, views, and Explores to define metrics once so every report and dashboard returns consistent live results.
- Streaming analytics flows from Pub/Sub for ingestion to Dataflow for transformation to BigQuery, Bigtable, or Cloud Storage for immediate dashboards and actions.
- Datastream is serverless change data capture where a stream uses source and destination connection profiles in the same region to replicate changes with minimal latency.
Frequently Asked Questions
When should I use Looker instead of Looker Studio for business intelligence reporting?
Choose Looker when you need governed, advanced analytics with a shared metric model, and choose Looker Studio when you need simple charts, reports, and dashboards. Looker applies a unified data model that defines each metric once so dashboards, scorecards, and scheduled reports show the same numbers, while Looker Studio builds simple charts and reports.
What do Pub/Sub and Dataflow each do in a streaming analytics pipeline to BigQuery?
Pub/Sub ingests and distributes messages but does not transform them, while Dataflow reads from Pub/Sub and performs the transform and delivery to BigQuery, Bigtable, or Cloud Storage. Data flows from apps, websites, servers, and sensors to Pub/Sub for capture, from Pub/Sub to Dataflow for processing, and from Dataflow to BigQuery, Bigtable, and Cloud Storage for immediate use.
How does BigQuery ML build machine learning models inside BigQuery?
BigQuery ML builds and trains machine learning models with SQL directly inside the warehouse, so data flows from tables into training and the trained model scores new rows without moving data. Analysis happens where the data lives using ANSI-standard SQL alongside Python with BigQuery DataFrames, geospatial functions, and federated queries.
When should I use a direct Pub/Sub to BigQuery subscription instead of a Dataflow pipeline?
Choose a direct Pub/Sub BigQuery subscription with a user-defined function for simple delivery to BigQuery, and choose a Dataflow pipeline when the stream needs complex transforms, joins, or enrichment before loading. Dataflow uses the same Apache Beam model for stream and batch to filter, aggregate, enrich, and run machine learning inference with exactly-once processing by default.
Subdomains
Smart analytics on Google Cloud is the use of serverless, scalable services to turn large volumes of raw data into insights that guide business decisions. BigQuery provides the fully managed, AI-r…
Evaluating core GCP services enabling streaming analytics means understanding how three services combine into one automated real-time pipeline. Streaming analytics turns continuous data flows into act…
A modern pipeline built with Pub/Sub and Dataflow splits data work into two managed stages that connect end to end. Pub/Sub ingests and distributes real-time events from many producers, and Da…
Establishment of a single source of truth via LookML means everyone in an organization uses the same centrally defined business rules when asking questions of data. Looker uses LookML as a semanti…
Looker is an enterprise platform for business intelligence, data applications, and embedded analytics that turns large datasets into interactive reports and dashboards. BigQuery stores and analyzes ve…
How learners score on this domain
Last updated