Seeking the thrill of transformative tech? Explore the art of designing and implementing DevOps solutions on Azure. Master the shift towards CI/CD, testing, and delivery, while preparing for the Designing and Implementing Microsoft DevOps Solutions exam!
Prepare and test your skills

Prepare and test your skills
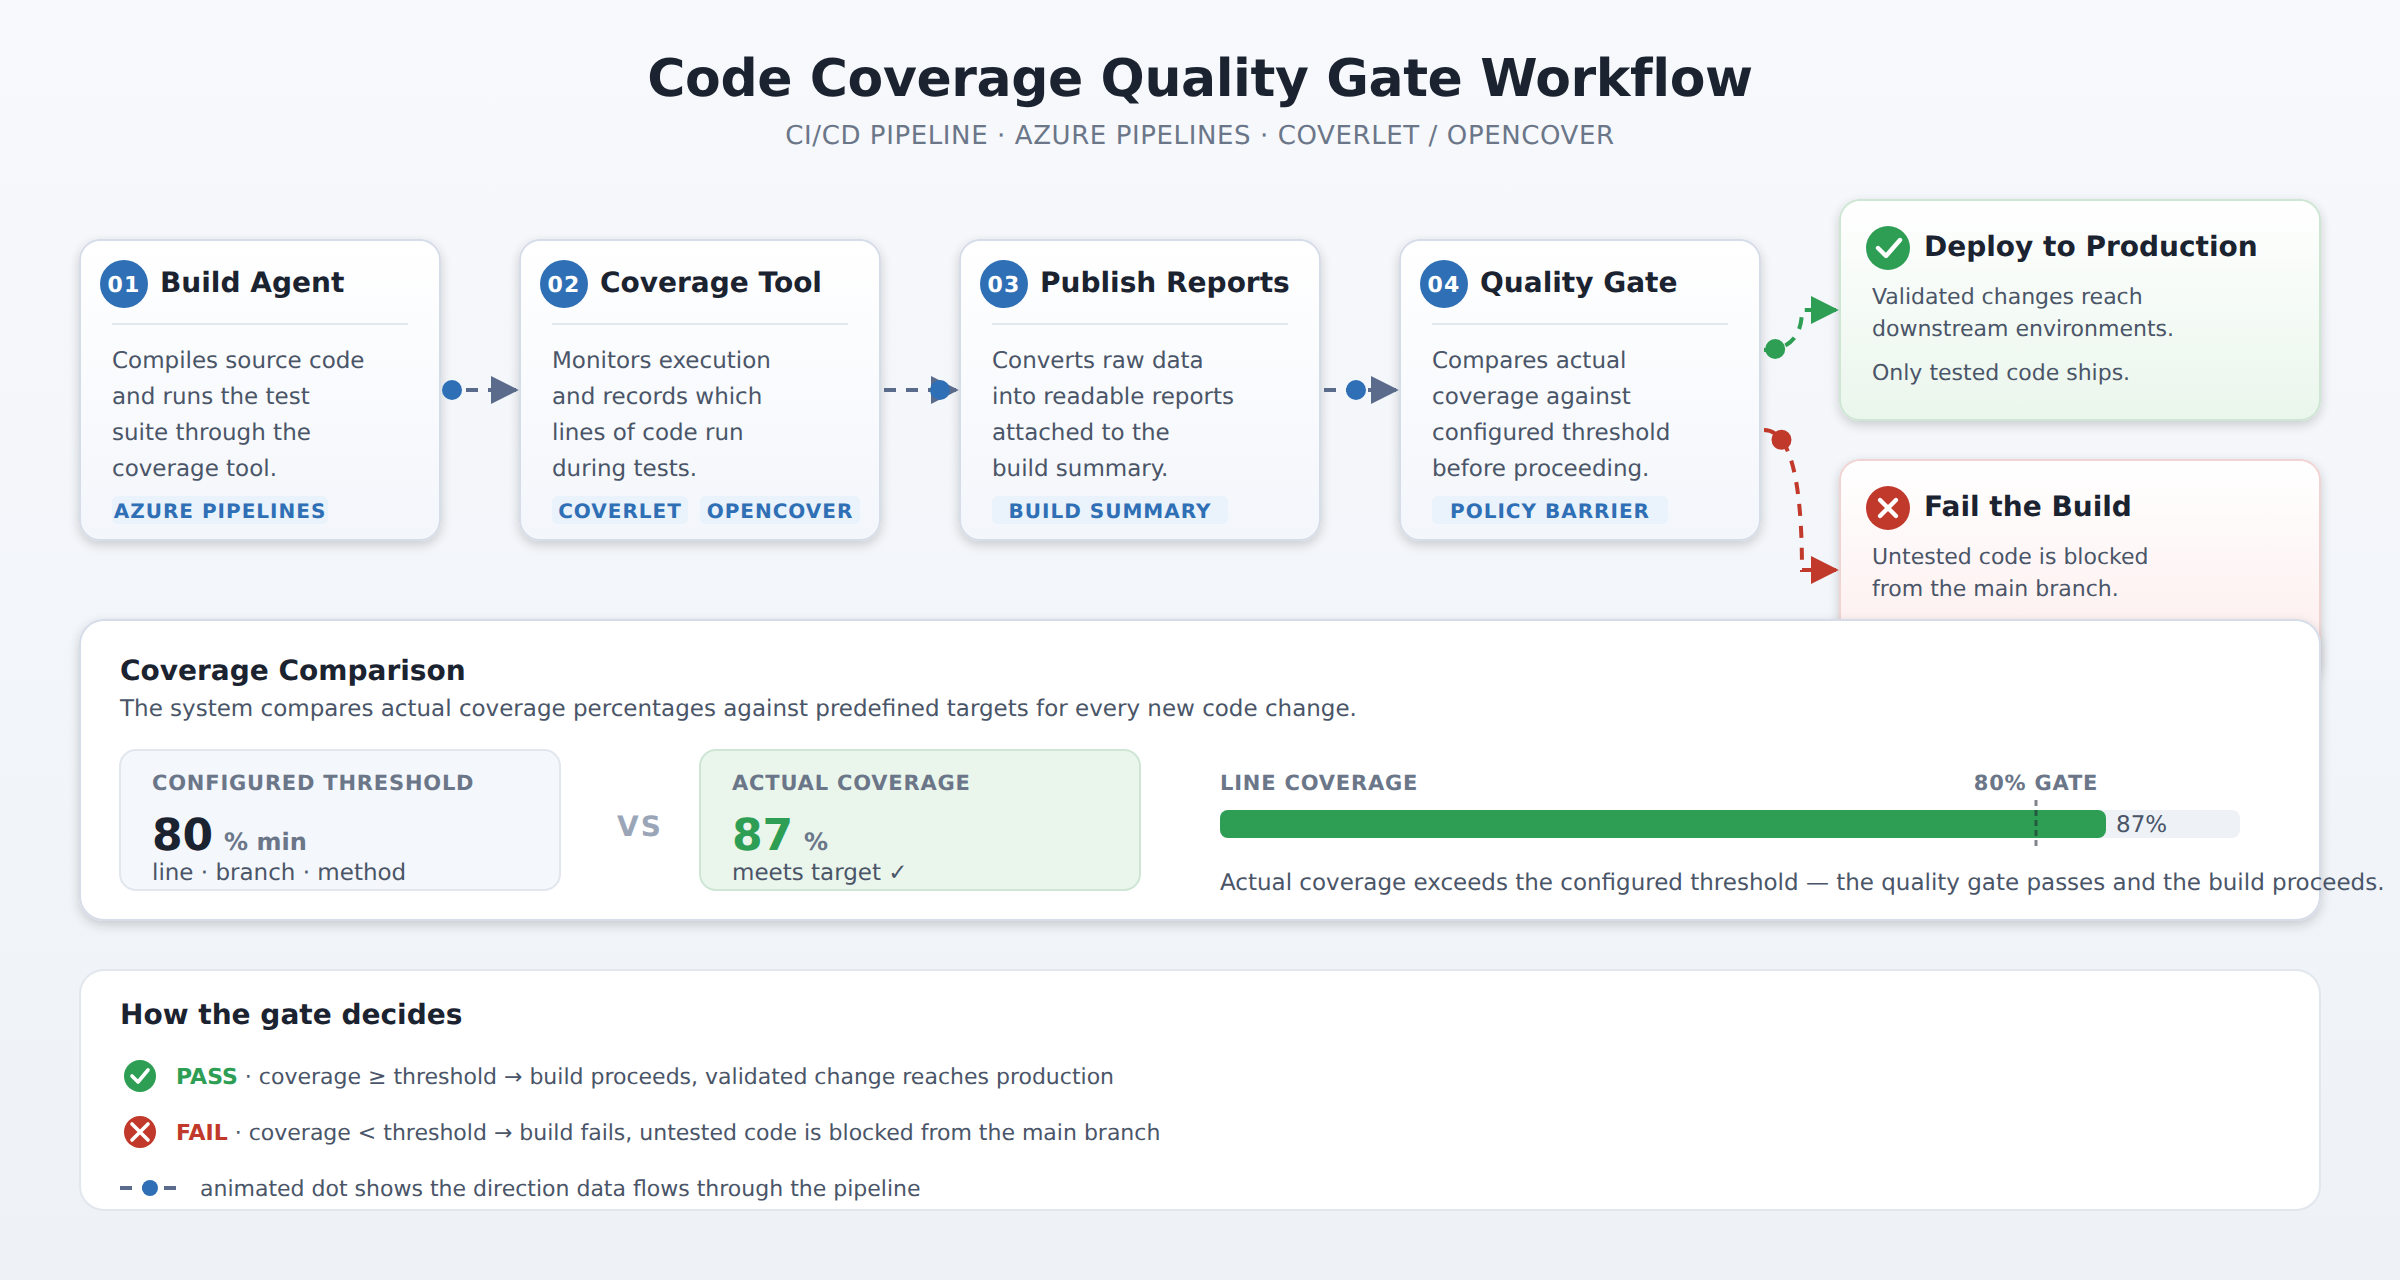
A horizontal pipeline diagram showing five stages of code coverage analysis: build agent compiles code, coverage tool runs tests and records executed lines, reports are published, coverage is compared against thresholds, and a quality gate either passes the build to production or fails it. Animated dots flow between stages to show the sequence.
Coverlet, OpenCover, and Visual Studio Test can be integrated directly into the Azure Pipelines build definition. These tools monitor code execution during test runs and record which lines of code are executed, then output raw coverage data that is converted into readable reports.
Coverage thresholds represent the minimum allowed percentage of code that automated tests must execute. They focus on metrics like line, branch, or method coverage and are configured within the build pipeline configuration or through the coverage tool settings.
A quality gate acts as a policy barrier that evaluates the results of the coverage analysis before allowing the pipeline to proceed. If the generated coverage percentage falls below the configured threshold, the quality gate fails the build, preventing untested code from moving forward in the deployment process.
Developers can use these reports to pinpoint specific classes, methods, or logic branches that lack test coverage. Reviewing these gaps helps the development team write targeted tests for critical, high-risk areas of the codebase and track whether code quality is improving or declining over time.
To verify that tests thoroughly check your application code, you must set up coverage collection within your CI/CD pipeline. Developers integrate automated tools like Coverlet, OpenCover, or Visual Studio Test directly into the Azure Pipelines build definition. These tools monitor code execution during test runs and record which lines of code are executed. The workflow begins when a build agent compiles the code, runs the test suite through the chosen tool, and outputs raw coverage data. Finally, a publishing task converts this raw data into readable reports that are attached directly to the build summary.
Defining coverage thresholds is essential to prevent untested code from slipping into production. These thresholds represent the minimum allowed percentage of code that automated tests must execute, focusing on metrics like line, branch, or method coverage. You configure these rules within your build pipeline configuration or through the coverage tool settings. When the pipeline runs, the system compares the actual coverage percentages against these predefined targets. This comparison provides an immediate, objective measure of test thoroughness for every new code change.
After a build completes, the pipeline exposes detailed coverage reports in the Azure DevOps user interface. Developers use these reports to pinpoint specific classes, methods, or logic branches that lack test coverage. Reviewing these gaps helps the development team write targeted tests for critical, high-risk areas of the codebase. Tracking these metrics over time also helps teams understand if code quality is improving or declining across releases.
To maintain high standards, you must enforce quality gates that automatically protect the main code branch. A quality gate acts as a policy barrier that evaluates the results of the coverage analysis before allowing the pipeline to proceed. If the generated coverage percentage falls below the configured threshold, the quality gate fails the build. This dependency prevents buggy or untested code from moving forward in the deployment process, ensuring that only validated changes reach downstream environments.
 StudyCerts
 StudyCerts