Diagram
Azure Monitor to DevOps Telemetry Pipeline
Process Flow
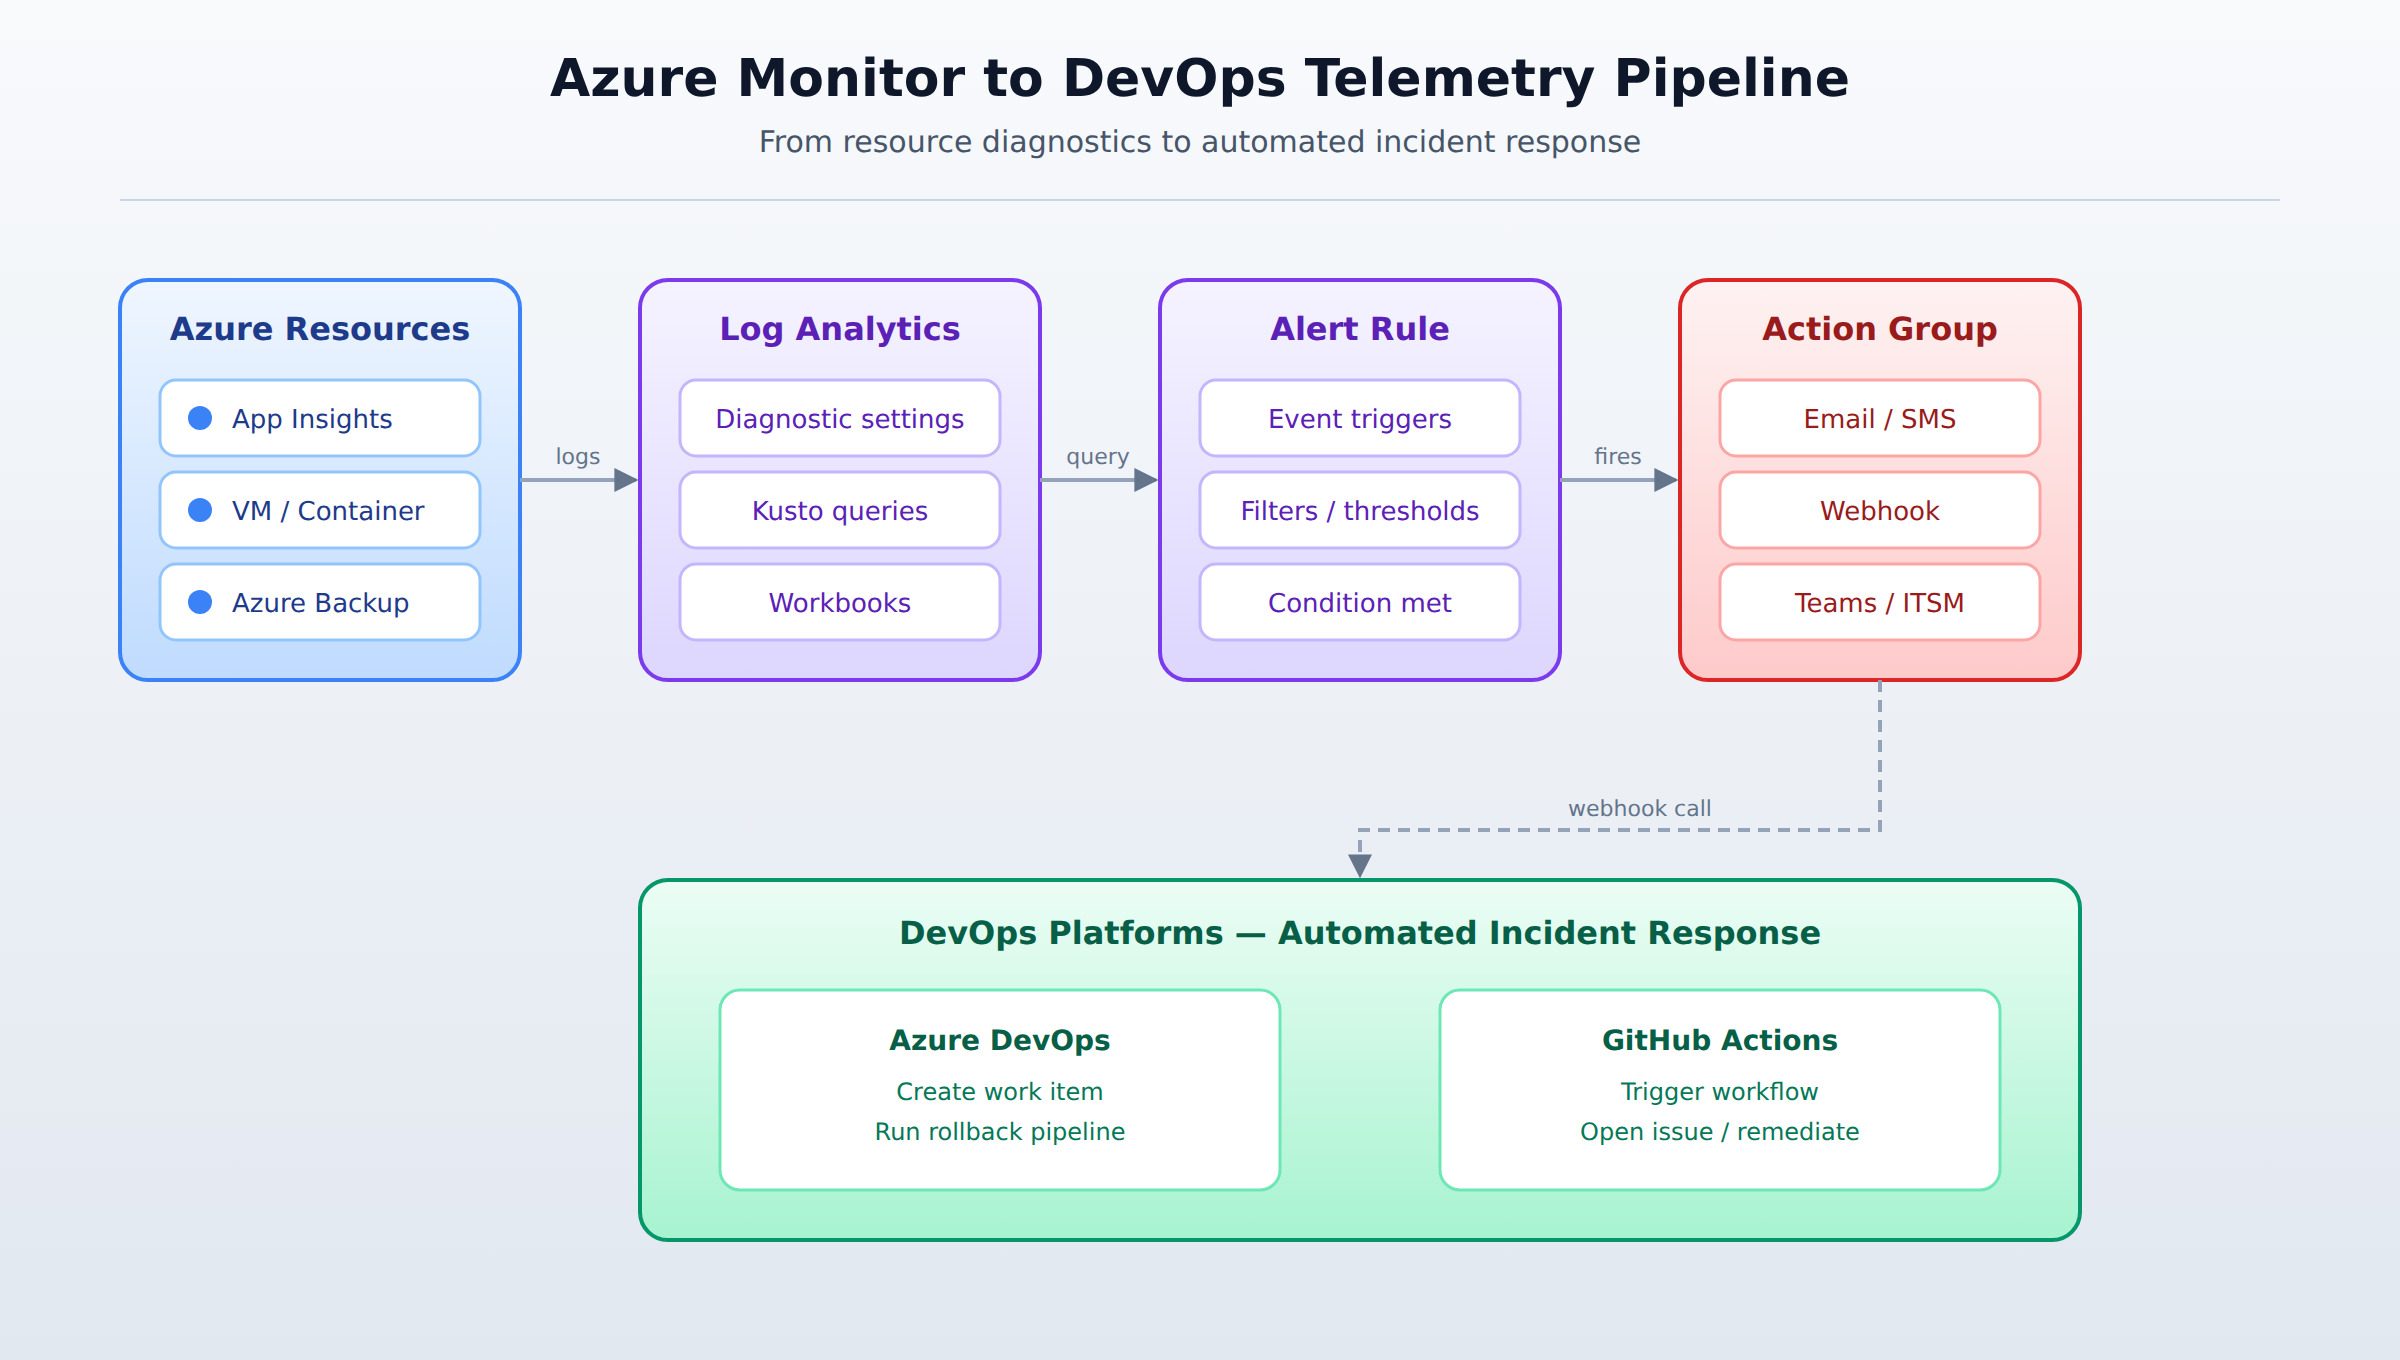
A left-to-right process flow showing how Azure resources send diagnostic logs to a Log Analytics workspace, where Kusto queries feed dashboards and alert rules. When an alert fires, an Action Group triggers a webhook to Azure DevOps or GitHub Actions to automate a response.
In the Domain
Configure Azure Monitor and Log Analytics to integrate with DevOps tools
To connect Azure monitoring with DevOps platforms, you first set up a telemetry pipeline by configuring diagnostic settings on each Azure resource. These settings decide which metrics and logs to collect and forward them to a Log Analytics workspace, where the data becomes available for analysis. You also choose which data sources to stream, such as performance counters or event logs.
Once the data is in Log Analytics, you write Kusto queries to filter and summarize the information. These queries feed into Azure dashboards and workbooks, giving teams a real-time overview of key metrics, like backup success rates or failure trends. When a condition in a query is met, an alert rule fires and triggers an Action Group. The Action Group can send an email, but more importantly it can call a webhook that reaches Azure DevOps or GitHub Actions, starting an automated response such as creating a work item or running a rollback pipeline.
Domain 1 of 2
Configure monitoring for a DevOps environment
Read the Domain summaryPractice this Domain
11 practice questions
Practice this DomainLast updated