Fundamental
Prepare and test your skills
Fundamental
Prepare and test your skills
Aggregating BigQuery Results Directly Into pandas DataFrames
Free sample question, answered and explained below. The Associate Data Practitioner practice bank has 1,132 more like it. Try 10 free: instant score, no account.
A retail analyst is investigating sales patterns across multiple product lines over the past two years to identify seasonal trends for an upcoming inventory planning meeting. The analyst uses a Jupyter notebook running in Vertex AI Workbench to examine the data stored in BigQuery.
The analyst has the following requirements:
- Aggregate monthly transaction metrics (total revenue and units sold) directly in BigQuery to minimize data transfer.
- Capture the aggregated query results directly into a pandas DataFrame variable within the notebook cell.
- Generate trend visualizations to evaluate patterns across product categories and interpret the results against business goals.
Which approach should the analyst use to accomplish these tasks?
Explanations
Run the aggregation SQL query in the BigQuery Studio SQL editor, download the tabular result as a local CSV file, and manually upload it into the JupyterLab file directory.
Run the aggregation SQL query in the BigQuery Studio SQL editor, download the tabular result as a local CSV file, and manually upload it into the JupyterLab file directory.
What this approach does
This workflow requires leaving the notebook interface to run the SQL query inside the BigQuery console SQL editor, saving the query results table to a local desktop workstation as a CSV file, and then manually uploading that file through the JupyterLab file browser before reading it into a DataFrame with pandas.
Why it doesn't meet the requirement
- Breaks workflow integration: Forces the analyst into a disjointed process that hops between the cloud console, a local computer, and the JupyterLab environment.
- Lacks reproducibility: Because data extraction depends on manual clicking, downloading, and uploading, the notebook cannot be automated, scheduled, or cleanly reproduced by colleagues.
- Violates data governance: Downloading business sales metrics to local client workstations introduces security and data privacy risks compared to keeping data entirely within the managed cloud environment.
Key characteristics and limitations
- Download limitations: The BigQuery console restricts direct browser file downloads to small result sets (typically up to 16,000 rows or 10 MB).
- Stale data: Updating the analysis when new sales figures arrive requires manually repeating the entire export, download, and upload procedure.
- Broken file dependencies: Notebooks containing paths to manually uploaded local files will fail when executed by other team members or on different runtime instances.
This answer would be correct if
A business stakeholder needed a one-off, static CSV export to open in a local desktop spreadsheet tool and no programmatic or visual notebook analysis was required.
Additional context
Vertex AI Workbench and BigQuery Studio offer direct notebook integrations specifically to eliminate manual file transfers. Using programmatic magics or client libraries maintains data lineage and enforces security within the cloud platform.
Execute the %bigquery_stats magic command passing the sales table name to automatically group revenue by month and visualize category trends.
Execute the %bigquery_stats magic command passing the sales table name to automatically group revenue by month and visualize category trends.
What the %bigquery_stats magic command does
The %bigquery_stats command is an IPython line magic included with the BigQuery client library. It is designed to perform quick exploratory data profiling on an existing BigQuery table by passing a table path (for example, %bigquery_stats project.dataset.table). When executed, it generates high-level summary statistics and basic distribution visualizations for each column in the table.
Why it doesn't meet the requirement
- Cannot execute custom aggregation logic: The
%bigquery_statsmagic command does not accept custom SQL queries,GROUP BYexpressions, or date truncations necessary to calculate monthly revenue trends. - Cannot build categorical trend lines: While it displays general column characteristics (such as null counts, distinct counts, and basic numeric distributions), it cannot create multi-series time-series line charts comparing categories over time.
- No DataFrame variable assignment: The command generates pre-formatted exploratory statistical summaries as output in the notebook cell rather than assigning a usable pandas DataFrame to a variable for custom plotting.
Key characteristics and limitations
- Single table target: Only accepts a table identifier as an argument, not customized SQL statements.
- Exploratory profiling focus: Intended for rapid initial inspection of table variables and data quality before writing queries.
- Fixed visualizations: Produces standardized summary graphics that cannot be customized to reflect business KPIs or time-series groupings.
This answer would be correct if
The analyst needed an automated, code-free way to profile a single table's overall data quality, column data types, null rates, and basic numeric spread before writing analytical queries.
Additional context
%bigquery_stats is valuable during initial data discovery. However, evaluating business trends across time and categories requires custom SQL aggregation and dedicated plotting tools.
Export the full raw transaction table from BigQuery to a Cloud Storage bucket, import the CSV files using pandas.read_csv(), and perform monthly aggregation locally in notebook memory.
Export the full raw transaction table from BigQuery to a Cloud Storage bucket, import the CSV files using pandas.read_csv(), and perform monthly aggregation locally in notebook memory.
What this approach does
This approach exports an entire raw transactional dataset from BigQuery into CSV files stored in a Cloud Storage bucket, downloads those flat files across the network, and loads them into notebook memory using pandas.read_csv(). Once all individual rows are held in local memory, standard Python operations group the data by month and category to prepare charts.
Why it doesn't meet the requirement
- Wastes compute and network resources: Exporting two years of unaggregated transactions to Cloud Storage and transferring gigabytes or terabytes of data over the network creates unnecessary egress, storage costs, and delays.
- Risks memory exhaustion: Loading large raw datasets into a Jupyter notebook instance using pandas frequently causes out-of-memory (
OOM) crashes and kernel terminations. - Ignores BigQuery's analytical engine: BigQuery is purpose-built to execute fast aggregations over massive datasets. Bypassing BigQuery in order to perform heavy data crunching inside a single notebook virtual machine is an anti-pattern.
Key characteristics and limitations
- Multi-step operational overhead: Requires configuring Cloud Storage buckets, setting up export jobs, and managing file paths.
- High latency: Exporting files and reading large CSV files locally takes significantly longer than running an aggregated SQL query directly in BigQuery.
- Scalability bottleneck: Local pandas data structures hold uncompressed data in RAM, limiting analysis to modest data sizes.
This answer would be correct if
The data was already stored as static CSV files in Cloud Storage, small enough to easily fit in memory, and required specialized, row-level Python algorithms unsupported by SQL.
Additional context
A primary best practice in cloud analytics is compute pushdown: executing filtering, joining, and aggregation inside the cloud data warehouse and transferring only the lightweight aggregated output to client environments.
Execute the aggregation query using the %%bigquery cell magic with a target variable name, and plot the resulting pandas DataFrame using built-in plotting methods.
Execute the aggregation query using the %%bigquery cell magic with a target variable name, and plot the resulting pandas DataFrame using built-in plotting methods.
What the %%bigquery magic command is
The %%bigquery magic command is an IPython cell magic provided by the BigQuery client library for Python. It allows data analysts to write and run native GoogleSQL queries directly inside a Jupyter notebook cell. When invoked with a variable parameter (such as %%bigquery monthly_sales), it submits the SQL query to the BigQuery cloud engine, converts the returned records into a pandas DataFrame, and assigns them directly to that Python variable.
BigQuery Magic to Plot Flow
Process Flow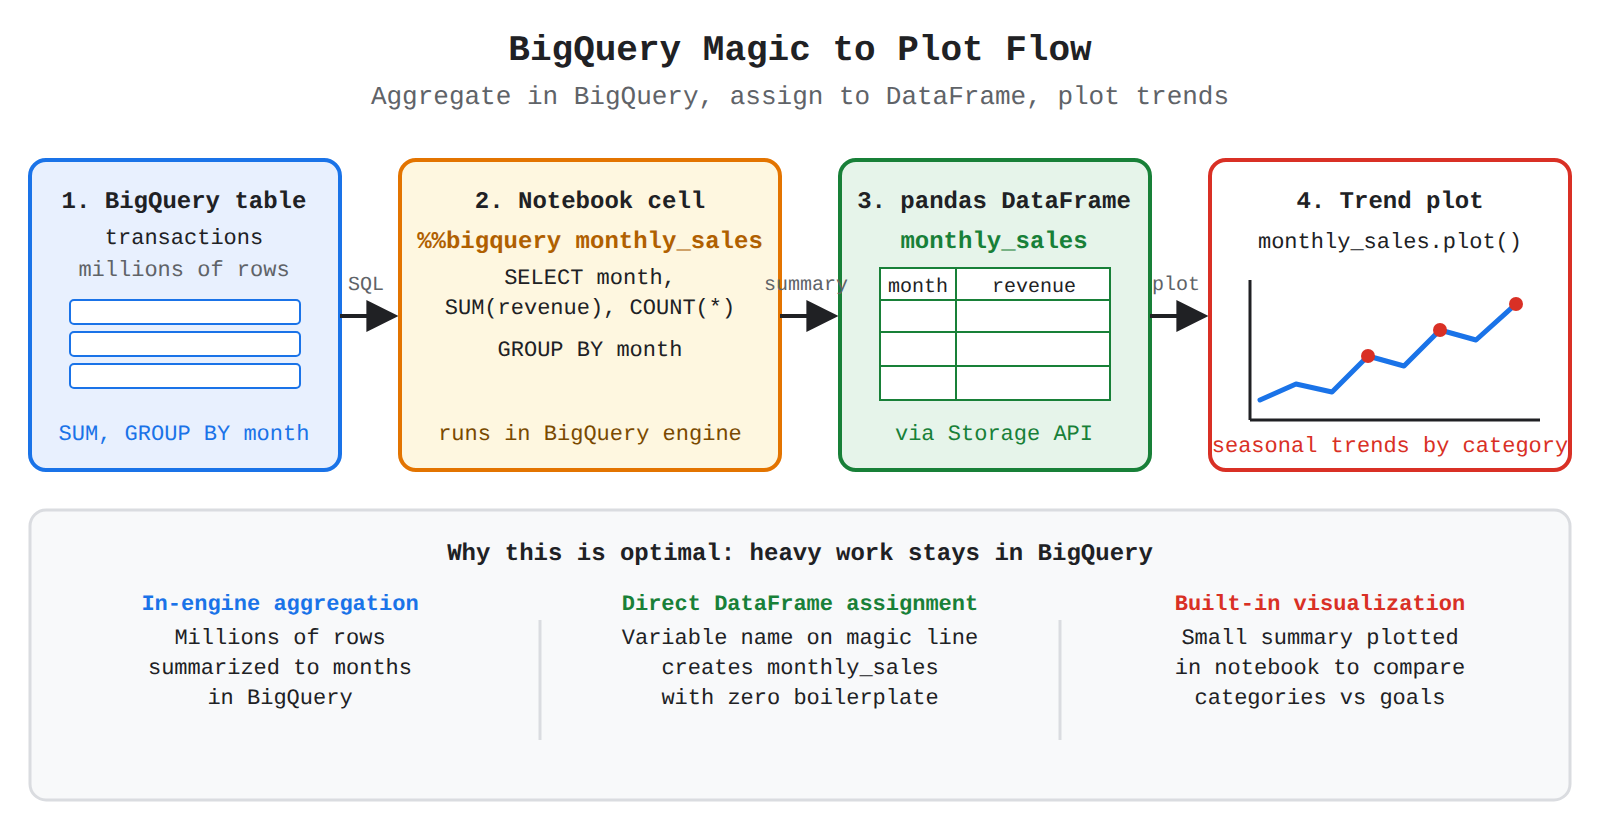
How it meets the requirements
- In-engine aggregation: The SQL query executes inside BigQuery's distributed architecture, computing monthly sums and counts across millions of records and transferring only the compact aggregated summary back to the notebook.
- Direct DataFrame assignment: Specifying a variable name on the magic line (e.g.,
%%bigquery monthly_sales) automatically instantiates a structured pandas DataFrame ready for immediate Python analysis without requiring manual connector code. - Built-in visualization: Once stored in a DataFrame, the analyst can call standard visualization methods such as
monthly_sales.plot(kind='line')or employ libraries likematplotlibandseabornto visualize seasonal trends and compare categorical performance.
Key advantages and capabilities
- Zero boilerplate code: Eliminates the need to manually instantiate a client object, submit execution jobs, or write conversion logic.
- Optimized data retrieval: Transparently utilizes the BigQuery Storage API behind the scenes to download query results rapidly into the notebook environment.
- Interactive exploration: Facilitates rapid iteration between refining SQL aggregations and modifying visual plots within the same interactive notebook interface.
- Reproducible reporting: Combines query logic, data transformations, chart outputs, and Markdown commentary into an auditable document for business stakeholders.
Why this is optimal
This approach leverages the massive compute scale of BigQuery to summarize large historical datasets while utilizing the visual and statistical power of Jupyter notebooks. It prevents memory bottlenecks on the notebook runtime and provides the most streamlined, standard workflow for trend analysis.
Try 10 interactive questions like this one, free
Answer them yourself and get your score the moment you finish. No account needed.
Full access includes
- 1,132 practice questions across all 4 exam domains
- Every answer explained: why it is right, and why the others are not
- Scout, an AI tutor that answers your follow-up questions
- Readiness tracking by domain, so you know when to book the exam
Related questions
Keep the momentum going with these hand-picked practice scenarios
FundamentalAssociate Data Practitioner
SQL GROUP BY with Aggregate Functions
Analyze data to answer business questions
FundamentalAssociate Data Practitioner
BigQuery APPROX_QUANTILES for Percentile Analysis
Analyze data to answer business questions
FundamentalAssociate Data Practitioner
Cloud Composer vs Workflows vs Dataproc Workflow Templates
Select a data orchestration solution (e.g., Cloud Composer, scheduled queries, Dataproc Workflow Templates, Workflows) based on business requirements
FundamentalAssociate Data Practitioner
Encryption In Transit vs Encryption At Rest
Identify the difference between encryption in transit and encryption at rest
FundamentalAssociate Data Practitioner
Dataform rowConditions Assertions
Assess data quality
AdvancedProfessional Cloud DevOps Engineer
Staging Organization for Policy Validation
Organizing resources (e.g., application-centric, projects, folders)
Last updated