Fundamental
Prepare and test your skills

Fundamental
Prepare and test your skills
Finding Checkout Latency With Trace Spans
Free sample question with answers and detailed explanation below. The Associate Cloud Engineer practice bank has an additional 2,014 practice questions.Try 10 free realistic questions: instant score, no credit card, and no account required.
An e-commerce company operates a multi-tier microservices application hosted on Google Cloud. When customers submit checkout orders, the request travels across an API gateway, an inventory verification service, an external payment processor, and a backend database. Customers report severe, intermittent delays during checkout, but CPU and memory utilization across all compute instances remain below 20%.
Which diagnostic tool and feature should you use to evaluate individual request spans and pinpoint the exact source of latency across these distributed services?
Explanations
Cloud Logging using Logs Explorer to search request and application log entries
Cloud Logging using Logs Explorer to search request and application log entries
What Cloud Logging does
Cloud Logging is a fully managed service that allows organizations to store, search, analyze, and monitor log data and events generated by Google Cloud infrastructure, system services, and custom applications. The Logs Explorer provides a rich query interface to filter logs by timestamp, severity level, resource type, and payload fields.
Why it doesn't meet the requirement
- Lacks visual span latency timelines: Cloud Logging records discrete, timestamped events and text strings. It does not natively construct chronological waterfall diagrams of execution layers or automatically calculate span durations across distributed calls.
- Manual correlation overhead: Although request logs and application logs capture HTTP response times and status codes, correlating separate log entries across multiple microservices to isolate which sub-operation caused a delay requires tedious manual query writing and log cross-referencing.
- Does not isolate dependency delays automatically: Logs provide point-in-time state records rather than a structured breakdown of child-parent execution relationships across distributed RPC boundaries.
Key characteristics and limitations
- Discrete event storage: Ingests structured and unstructured log records generated at specific moments in execution.
- Text and JSON filtering: Uses the Logging query language to locate error messages, HTTP status codes, and user-defined messages.
- Log router sinks: Primarily used for exporting log entries to long-term storage destinations such as BigQuery, Cloud Storage, or Pub/Sub.
- No native distributed latency mapping: Cannot visually break down nested latency contributions across microservice dependencies without external trace tools.
This answer would be correct if
This option would be the ideal choice if developers were investigating specific runtime exceptions, application crash dumps, error stack traces, or auditing security events and HTTP response codes.
Additional context
Although Cloud Logging is not the primary tool for distributed latency visualization, it tightly integrates with Cloud Trace. Traces and logs can share trace identifiers, allowing operators who spot an anomalous span in Cloud Trace to jump directly into correlated logs for deeper root-cause debugging.
Cloud Monitoring using metric dashboards to track 99th percentile latency
Cloud Monitoring using metric dashboards to track 99th percentile latency
What Cloud Monitoring does
Cloud Monitoring provides visibility into the performance, uptime, and overall health of cloud applications and cloud infrastructure. It aggregates numerical metrics, creates custom charts and dashboards, and triggers alerting policies when metrics (such as request count, error rate, or 99th percentile latency) cross defined thresholds.
Why it doesn't meet the requirement
- Aggregated metrics without span context: Cloud Monitoring displays high-level aggregated performance metrics over time (such as median or 99th percentile response time), but it cannot break down a single transaction into its constituent execution spans.
- Cannot pinpoint specific internal layers: While an alert or dashboard in Cloud Monitoring can inform operators that checkout latency has spiked, it cannot show whether that specific delay happened inside the inventory service, the payment gateway, or the database layer for a given request.
- No distributed request flow tracing: Cloud Monitoring measures statistical counters and distribution histograms; it does not follow or inspect the end-to-end execution path of individual transactions across distributed services.
Key characteristics and limitations
- Time-series data: Collects, aggregates, and stores numerical telemetry data points over predefined time intervals.
- High-level alerting: Alerts operators when latency thresholds or system resource limits are breached across an entire service fleet.
- Statistical percentiles: Calculates 50th, 95th, and 99th percentile aggregates across millions of requests rather than detailing individual request lifecycles.
- No span waterfall diagrams: Lacks the ability to display sub-operation timing bars or cross-service trace propagation graphs.
This answer would be correct if
This option would be the right choice if the objective were to establish real-time alerting notifications when overall checkout latency exceeds an SLA threshold, or to plot macro-level latency trends on an operational dashboard over days or weeks.
Additional context
Cloud Monitoring and Cloud Trace work in tandem. Typically, Cloud Monitoring acts as the first line of defense by alerting engineers to elevated 95th or 99th percentile latency, after which engineers navigate to Cloud Trace to diagnose the specific distributed bottleneck causing that latency.
Cloud Trace using Trace Explorer to inspect spans in a waterfall visualization
Cloud Trace using Trace Explorer to inspect spans in a waterfall visualization
What Cloud Trace is
Cloud Trace is a distributed tracing system designed specifically for Google Cloud and hybrid environments. Its primary purpose is to collect latency information from instrumented applications and Google Cloud services, allowing developers and administrators to track how user requests propagate through complex, multi-service architectures. A single end-to-end transaction is represented as a trace, which is subdivided into individual units of execution known as spans.
How it meets the requirements
- Pinpoints latency across distributed services: Cloud Trace captures timing information as requests flow across multiple service boundaries, including API calls, remote procedure calls (RPCs), and external dependencies.
- Evaluates individual request spans: Through the Trace Explorer in the Google Cloud console, operators can select slow requests from an aggregated latency heatmap and drill down into the request's individual spans.
- Waterfall visualization: Each span displays start time, duration, and metadata in an intuitive waterfall timeline. This immediately highlights whether the bottleneck originates from database queries, external payment gateways, or internal network delays.
- Troubleshooting with low resource utilization: Because server CPU and memory usage are low, the latency is likely caused by blocking I/O, external network calls, or downstream waits. Cloud Trace excels at exposing these idle wait states across distinct microservices.
Checkout Trace Waterfall Pinpoints Slow Span
Timeline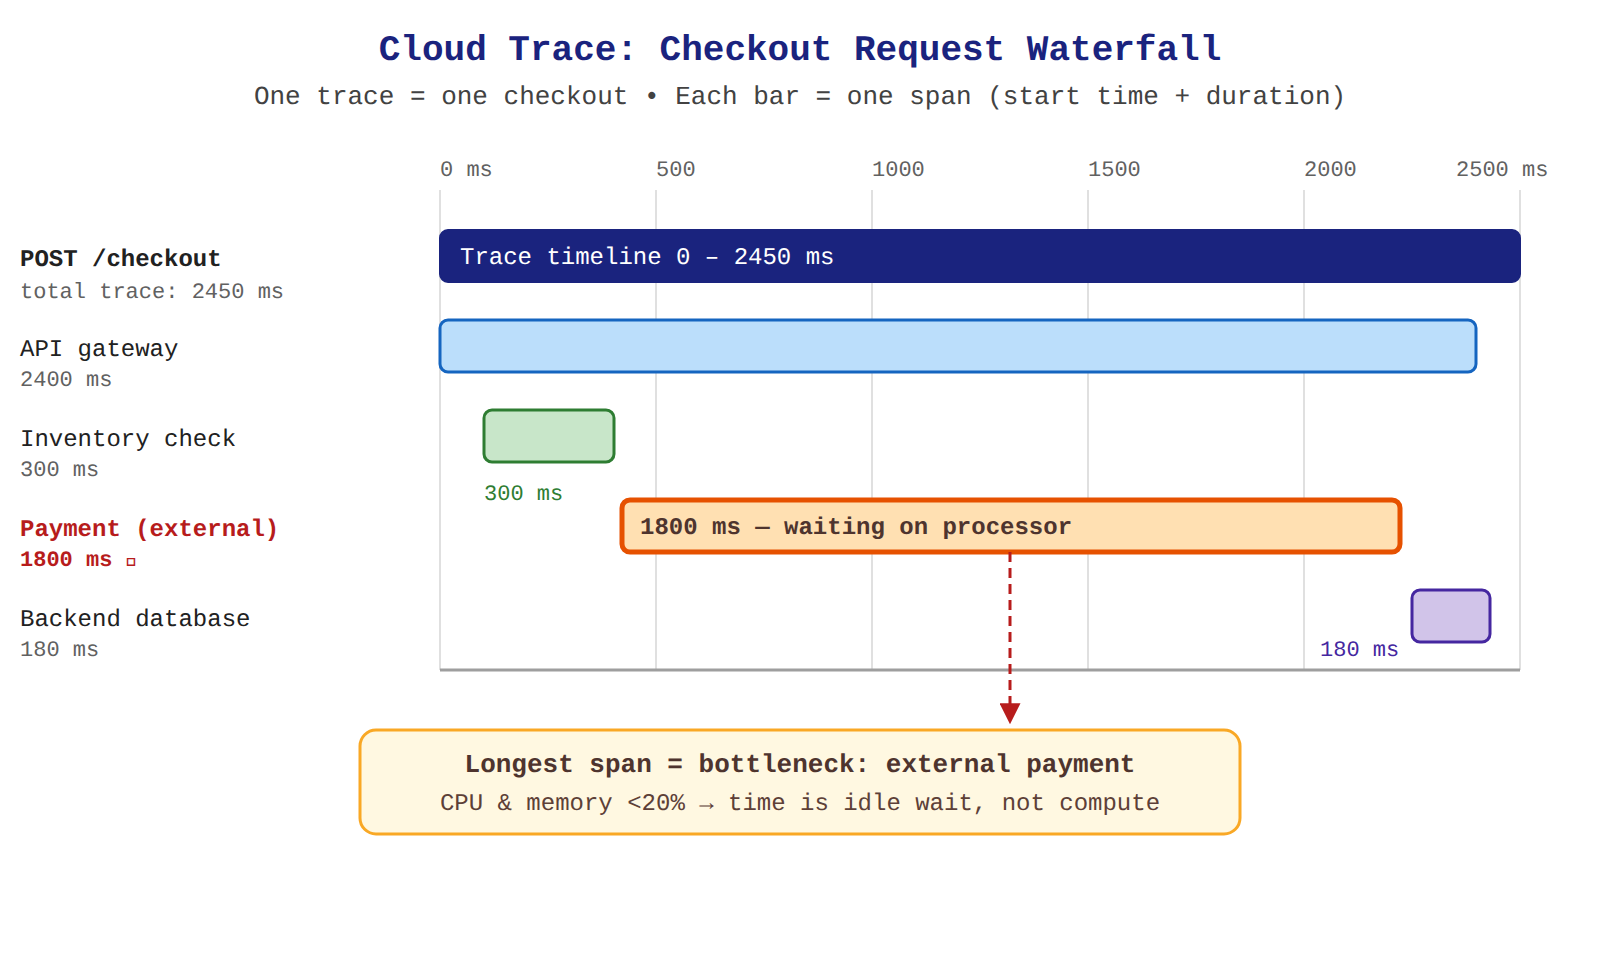
Key advantages and capabilities
- End-to-end request visibility: Provides unified visualization of a transaction across multiple services, containers, and serverless environments.
- Visual waterfall breakdown: Breaks down complex nested operations into chronological, color-coded bars indicating the duration of each sub-operation.
- Automated and custom instrumentation: Seamlessly integrates with open standards like OpenTelemetry and captures built-in traces automatically on platforms such as Cloud Run and App Engine.
- Heatmap and percentile analysis: Offers an interactive latency distribution heatmap in the Trace Explorer to filter outliers and analyze 50th, 90th, and 99th percentile requests.
- Context propagation: Uses standard W3C trace context headers (
traceparent) to stitch together parent and child spans across microservice boundaries.
Why this is optimal
Cloud Trace is the only Google Cloud observability tool built from the ground up for distributed tracing and span-level timing analysis. While monitoring tools can signal that an overall service is slow and logging tools can display discrete event records, only Cloud Trace maps out the exact sequence and timing of interdependent calls across distributed microservices.
Cloud Profiler using flame graphs to analyze call tree execution overhead
Cloud Profiler using flame graphs to analyze call tree execution overhead
What Cloud Profiler does
Cloud Profiler is a continuous statistical profiling tool designed to analyze CPU utilization and memory allocations inside running application code. It operates by periodically sampling call stacks across production workloads, aggregating this execution data into interactive flame graphs to show which specific functions or lines of code consume the most system resources.
Why it doesn't meet the requirement
- Does not track distributed request flows: Cloud Profiler collects process-level profiling statistics within individual application instances rather than following a specific transactional request across multiple distributed services.
- Ineffective for I/O and external wait bottlenecks: In this scenario, CPU and memory utilization are below 20%, indicating that the slowdown is caused by blocking network operations, downstream service delays, or database waits, rather than intensive CPU computation or memory thrashing.
- Lacks request span visualization: Cloud Profiler does not record transaction spans, RPC boundaries, or chronological waterfall timelines for individual user transactions.
Key characteristics and limitations
- Statistical sampling: Collects periodic snapshots of call trees across all executing threads rather than recording end-to-end individual transactions.
- Resource-consumption focus: Specifically highlights CPU time, heap allocations, and thread contention rather than end-to-end request latency across microservices.
- Single-service context: Displays aggregated code performance for a single application binary rather than tracing dependencies between separate microservices.
- No span attribution: Does not generate or display distributed trace identifiers or parent-child span relationships.
This answer would be correct if
This option would be the right choice if the application instances were suffering from sustained 100% CPU utilization or excessive garbage collection overhead, and developers needed to identify computationally expensive methods or memory leaks within a specific codebase.
Additional context
While Cloud Profiler and Cloud Trace are both diagnostic tools in Google Cloud, they serve complementary purposes. Cloud Trace answers where time is spent across services (distributed latency), whereas Cloud Profiler answers which functions consume compute resources inside an instance (code efficiency).
Try 10 interactive questions like this one, free
Answer them yourself and get your score the moment you finish. No account needed.
Full access includes
- 2,014 practice questions across all 4 exam domains
- Every answer explained: why it is right, and why the others are not
- Scout, an AI tutor that answers your follow-up questions
- Readiness tracking by domain, so you know when to book the exam
Related free sample questions
Keep the momentum going with these hand-picked practice scenarios
FundamentalAssociate Cloud Engineer
Cloud SQL Query Insights Index Advisor
Using cloud diagnostics to research an application issue (e.g., Cloud Trace, Cloud Profiler, Query Insights, index advisor)
FundamentalAssociate Cloud Engineer
Cloud Profiler Continuous CPU Heap Profiling
Using cloud diagnostics to research an application issue (e.g., Cloud Trace, Cloud Profiler, Query Insights, index advisor)
FundamentalAssociate Cloud Engineer
Compute Engine Full OS Control
Selecting appropriate compute choices for a given workload (e.g., Compute Engine, Google Kubernetes Engine [GKE], Cloud Run, Cloud Run functions, Knative serving)
FundamentalAssociate Cloud Engineer
Standard vs Premium Network Service Tiers
Differentiating Network Service Tiers
FundamentalAssociate Cloud Engineer
Google Cloud Predefined IAM Roles
Granting members Identity and Access Management (IAM) roles within a project
FundamentalGenerative AI Leader
Vertex AI Agent Builder Grounding
Platforms
Last updated