Fascinated by the world of cloud databases? Explore the methods for structuring, scaling, and securing database solutions on Google Cloud as you gear up for the Professional Cloud Database Engineer exam!
Prepare and test your skills
Prepare and test your skills
To keep a database healthy, an administrator must monitor CPU capacity and the query load on the instance. The Query Insights tool helps find the source of performance problems by filtering data by database, user, or IP address. Looking at the top contributors to database load shows whether high resource use comes from a specific application or from inefficient queries. A high average execution time paired with low row counts usually points to missing indexes that need to be created.
Key metrics for diagnosing slow queries include average execution time (how long a query takes), wait events (the specific reason a query is paused, such as waiting for a lock), and times called (how often the application runs that query). When designing an indexing strategy, properties that are never used in query filters should be excluded to save storage and lower latency. Indexes speed up reads, but too many composite indexes slow down writes and increase costs. To prevent hotspotting (many writes hitting a narrow key range), avoid using monotonically increasing values like sequential IDs or timestamps; instead use well-distributed IDs. Writing efficient queries also reduces load: using projection queries or keys-only queries retrieves only the needed fields, and replacing query offsets with cursors avoids unnecessary internal processing. For very large ad-hoc datasets, moving the workload to BigQuery may be more effective than managing many complex indexes.
Query Insights lets engineers monitor database load in real time and compare it against the instance’s maximum CPU capacity. The Top dimensions by database load table shows which specific queries consume the most resources. Administrators can filter performance data by database, user, or IP address to isolate high-latency operations. This visibility is crucial for maintaining high transaction throughput and finding queries that stall due to insufficient resources.
Evaluating slow queries requires analyzing metrics that show how resources are spent during execution: average execution time, wait event types (categories of events that cause a query to pause), and times called (how often the query is triggered). Excluding unused properties from indexes reduces storage costs and avoids write delays. Performance can also suffer from hotspotting and locking issues when heavy workloads target a narrow range of keys. Tracking the lock wait time is essential for diagnosing contention, which measures how long a transaction waits for another process to release its lock.
Data contention happens when two or more operations try to access or modify the same document at the same time. Database systems resolve these conflicts using rules called concurrency controls. Knowing whether the database uses optimistic or pessimistic rules helps administrators diagnose performance issues and transaction failures. Optimistic concurrency controls assume conflicts are rare, so they do not use database locks — instead, the system checks if the document changed during the transaction and only writes if the data is untouched. This approach is ideal for mobile apps with unreliable connections. Pessimistic concurrency controls assume conflicts are likely and use database locks to block other operations. When a pessimistic transaction fails due to high contention, the database returns an ABORTED error, meaning the operation must be retried.
Engineers can use monitoring tools to analyze wait events and identify blocking sessions, where one operation is stuck waiting for another to release its lock. Pinpointing these sessions allows administrators to resolve bottlenecks and optimize throughput. The key metrics during diagnosis include average execution time, wait event types (reasons for delay), and total execution time (cumulative time spent on a query across all calls).
Managing a database requires tracking its key health indicators, called "vitals," which include CPU utilization and RAM (memory) consumption. These represent the processing power and temporary working space the instance uses. You must monitor them to ensure the database can handle its workload without slowing down or crashing, and to determine if the instance is the right size. Google Cloud’s Cloud Monitoring service is the central tool for tracking these metrics. It automatically collects data using built-in agents. Important metrics include the percentage of CPU Utilization, Memory Utilization (excluding disk caches), and records of security events in Cloud Logging. This data helps you establish normal performance and identify when something is wrong.
When performance is slow, you look for bottlenecks — points where a lack of resources limits overall speed. For example, high CPU usage or insufficient memory can cause delays. Google Cloud’s Active Assist provides intelligent recommendations. The Underprovisioned Instance Recommender suggests when to add more CPU or RAM, while the Overprovisioned Instance Recommender finds instances that are too large, helping you save money. Setting up alerting policies in Cloud Monitoring, such as an alert for low disk space, helps you react to problems before they become critical.
Understanding your database’s internal state relies on collecting data it generates, known as telemetry, which includes metrics, logs, and traces. Google Cloud automates this collection. Cloud Monitoring gathers resource metrics, Cloud Logging collects event logs, and Cloud Trace analyzes request flow, giving you full observability into the system’s health. A critical part of this is Cloud Audit Logs, which track "who did what, where, and when." There are four main log types: Admin Activity logs record configuration changes and are always on; Data Access logs track when data is read or modified but must be turned on manually; System Event logs are generated by Google’s systems for events like restarts. To maintain security and compliance, you must regularly review these logs, using tools like the System Insights dashboard to see how system events affect performance.
Different database engines handle audit logging differently. For example, SQL Server uses audit specifications to send logs to Cloud Storage, while PostgreSQL often uses the pgAudit extension to record detailed SQL commands. Investigating these logs is key for troubleshooting failures and ensuring only authorized users access data. You control who can see the logs using Identity and Access Management (IAM) roles, and you can route logs to destinations like BigQuery for analysis or Pub/Sub for real-time security monitoring.
Database performance is heavily influenced by the type of storage and how well it handles input/output (I/O) operations. Choosing the right storage is the first step. SSD storage is fast and efficient for most workloads, while HDD is better for large, infrequently accessed data that is not sensitive to delays. To understand storage health, you monitor specific metrics: IOPS (number of read/write operations per second) and throughput (how much data is transferred). High disk latency or a long queue length (waiting operations) often means the storage is struggling to keep up. You track these using Cloud Monitoring and the Ops Agent, which provide dashboards to see disk utilization and I/O performance in real time, helping you spot bottlenecks.
If your instance hits storage performance limits, you can often fix it by resizing the persistent disk — increasing the disk’s size automatically raises its IOPS and throughput limits. Sometimes upgrading the machine type to have more vCPUs is also necessary, because the overall instance can limit total disk performance. Managing capacity is also done through automated scaling features that increase storage when needed, and by using Active Assist recommendations to right-size your resources, balancing cost and performance.
Google Cloud uses quotas to manage resource usage and ensure fairness across all projects. Quotas are adjustable limits on resources like CPU or API calls, while system limits are fixed and cannot be changed. To maintain service availability, you must regularly monitor your usage through the Google Cloud console or the gcloud CLI. Key tools for monitoring include the IAM & Admin Quotas page for viewing current limits, Cloud Monitoring for alerts when usage approaches a limit, and the gcloud CLI for programmatic checks of regional and project-wide resources. When your workload grows, you may need to request a quota adjustment to prevent service failures. This formal process requires a technical justification, which should include data like consumption rates, future growth plans, and specific regions. If an automated request is denied, you can file a support case or contact your technical account manager. The Quota Adjuster is an automated tool that proactively requests increases on your behalf by monitoring your peak usage and submitting requests when you approach your limits to prevent unexpected outages.
Efficient resource usage is achieved through architectural optimizations and coding best practices. Implementing exponential backoff and client-side rate limiting helps spread out traffic spikes and reduces the total quota needed. The Capacity Planner helps you view forecasted usage and historical data to prepare for high-traffic events or peak seasons. You should also conduct disaster recovery testing to identify gaps in your capacity planning and ensure your database solutions remain scalable.
Quotas are restrictions that control how much of a Google Cloud resource a project can use to ensure fairness and prevent service overloads. These restrictions usually apply at the project level, meaning usage in one project does not affect the available resources in another. Most database services, such as Cloud SQL and Bigtable, use these settings to help administrators manage costs and resource availability. Administrators need specific IAM permissions, such as the Quota Administrator role, to view or request changes to these values. There are two primary types of quotas: allocation quotas and rate quotas. Allocation quotas limit the total number of resources you can have at one time, such as the number of Cloud SQL instances or Cloud Spanner nodes. Rate quotas limit how many API requests you can make within a specific timeframe, such as Connect requests to look up database connection values, Get requests to retrieve information, and Mutate requests to create, modify, or delete resources.
Quotas are also defined by their geographical scope, which can be global, regional, or zonal. Regional quotas restrict resource usage within a specific area, and using resources in one region does not impact the quota available in another. It is important to remember that having a quota does not guarantee resource availability, as a physical resource might be temporarily depleted in a specific zone. Monitoring these metrics through Cloud Monitoring allows engineers to discover problems between their instances and the API before they impact users.
Quotas are imposed limits that restrict how much of a Google Cloud resource a project can use to ensure fairness and prevent resource spikes. To maintain continuous availability of database solutions, engineers must track these limits using the Quotas dashboard and Cloud Monitoring. Google Cloud provides several tools for observability into resource utilization, including Cloud Monitoring for performance and health visibility, Cloud Logging for detailed records for auditing and troubleshooting, and BigQuery Reports for prebuilt summaries of storage resource utilization. Setting up alerting policies is a critical step for proactive management to identify potential resource exhaustion before it causes an outage. Engineers can create alerts that trigger when usage exceeds a certain percentage, such as 80% of the total limit. Using Prometheus Query Language (PromQL) allows for more complex monitoring, including tracking the ratio of usage to limits, monitoring specific regions or zones, and alerting on quota/exceeded errors. Most increases are requested through the Google Cloud console, requiring the serviceusage.quotas.update permission.
Different database technologies have unique resource-specific quotas that require specialized monitoring. Cloud SQL tracks rate quotas for API categories like "Connect" and "Mutate," while BigQuery monitors slot utilization and query execution times. AlloyDB focuses on vCPU quotas and cluster counts per region. Regularly reviewing these metrics ensures that multi-technology environments remain scalable and performant. The Quota Adjuster can be enabled to automatically submit requests for increases when usage nears a limit, helping prevent unplanned outages and reducing manual intervention.
Resource contention often occurs when multiple database transactions try to access the same database resource at the same time, leading to performance delays. Both Cloud SQL and AlloyDB monitor the lock wait ratio to detect when a system is struggling with these conflicts. A significant increase in this ratio indicates database resource contention, which often results in performance dropping below established thresholds. To resolve lock contention, administrators use Query Insights and the Active Queries dashboard to identify blocking sessions — specific queries that hold locks and prevent others from completing. Pinpointing these queries allows database engineers to perform targeted optimizations. The standard troubleshooting workflow involves reviewing the Active Queries dashboard to see which sessions are waiting, using Gemini Cloud Assist to get AI-driven recommendations and remediation advice, and analyzing query plans to see how the database executes specific commands and where it slows down.
Transaction isolation levels define how data changes made by one operation are visible to other concurrent operations. Engineers must choose the correct isolation level, such as read committed, repeatable read, or serializable, to balance data consistency against system speed. For example, Cloud SQL for MySQL defaults to repeatable read to ensure transactions see a consistent snapshot of data. Database configuration flags also play a major role in managing how locks and memory interact. The max_locks_per_transaction setting determines how many objects a single transaction can lock simultaneously — setting it too low can cause transaction errors, while setting it too high might lead to memory exhaustion. Finally, implementing Managed Connection Pooling can significantly reduce the impact of resource contention. This feature allows the database to efficiently reuse existing connections rather than creating new ones for every request, reducing the overhead of connection management and helping the database focus on executing queries faster, especially when combined with creating database indexes.
Resource contention occurs when multiple database processes compete for limited system components, creating performance bottlenecks. In horizontally scalable services like Cloud Spanner and Bigtable, identifying distributed resource hotspots is essential for maintaining high availability. Administrators must monitor key metrics like the lock-wait ratio and CPU utilization to detect early anomalies and determine if the database is under stress. To investigate high database load, tools like Query Insights and Metrics Explorer provide evidence of performance issues. These tools help identify the most resource-intensive requests, known as TopN queries, that impact the system. Common indicators of a distributed resource hotspot include significant increases in Queries Per Second (QPS), spikes in disk input/output operations per second (IOPS) or throughput, and high 99th percentile latency for read or write requests.
Connection exhaustion happens when a database reaches its maximum limit of active sessions, which often triggers an Out of Memory (OOM) event. Implementing connection pooling is a critical strategy to efficiently reuse existing connections and prevent system crashes. Monitoring the count of active sessions ensures that internal overhead and user requests do not exceed the limits of physical memory. When databases reach their resource limits, engineers must implement effective scaling strategies to restore performance. This can involve scaling up by increasing vCPU and memory, or scaling out by adding more compute capacity to handle larger workloads. If latency continues to trend upward, engineers should optimize the database schema and resolve underlying concurrency issues.
Resource contention occurs when multiple database processes compete for limited system resources, resulting in noticeable performance slowdowns. Engineers use Google Cloud Monitoring and Query Insights to track key metrics and detect system-level bottlenecks. These bottlenecks typically manifest as high CPU usage, disk I/O latency, and memory pressure. CPU utilization and memory pressure are the primary indicators of system-level stress. A high CPU wait ratio often suggests that the system is overloaded with too many concurrent queries or inefficient execution plans. To prevent critical Out of Memory (OOM) events, administrators must monitor several resource components: memory usage components (tracking free versus cached memory), active connections (to manage the number of simultaneous user sessions), and the database buffer pool size (ensuring enough memory is allocated for data caching).
Disk I/O latency and lock contention can also significantly delay database responsiveness. When one transaction holds a resource that another transaction needs, the lock-wait ratio increases. Engineers can analyze disk metrics such as IOPS, throughput, and disk wait events to determine if the system is stalled waiting for disk reads or writes. Once a system bottleneck is identified, engineers can take several remediation steps to restore database performance. These actions include scaling up the instance to add more vCPUs and memory, or optimizing queries to reduce their resource footprints. Adjusting database flags like innodb_buffer_pool_size or work_mem helps fine-tune how the database allocates memory and handles heavy workloads.
Effective incident management depends on continuous monitoring to identify issues and automation to streamline repetitive tasks. These building blocks help create a resilient environment by using data-driven insights to optimize cloud operations. Proactively adjusting performance and reliability reduces the risk of costly downtime across different database technologies. Establishing clear incident response procedures ensures every team member knows their role during a crisis. Organizations should document these steps in a Runbook, which acts as a standardized guide for triage, investigation, and resolution. Maintaining clear communication protocols and escalation paths allows for a coordinated response when high-severity issues arise.
Alerting policies are essential tools that tell the system to notify staff when specific performance or error conditions occur. Users can install pre-configured policies through the Integrations page to monitor metrics for particular database workloads. Selecting the correct notification channels during setup ensures that alerts do not fire silently without reaching the intended audience. A robust notification strategy uses diverse communication channels to keep stakeholders informed. Common channels include PagerDuty (maps severity values to ensure the right level of urgency reaches responders), SMS (sends direct mobile alerts after a verification code confirms the contact number), and Slack (lets alerting policies post updates directly to a specific workspace or channel for team collaboration). Centralized incident management systems provide a single place to track an incident throughout its lifecycle. Tools like the Metrics explorer and custom Dashboards let engineers visualize performance data using PromQL or MQL queries. Regularly reviewing job progress and success helps maintain the integrity of database operations and overall system health.
Log-based alerting is a critical method for proactive incident response in cloud databases. It involves creating specific filters to find error patterns, system failures, or security events within database logs. By setting up these alerts, engineers receive immediate notifications when critical operational issues occur. This helps keep the database fleet healthy and reliable across different technologies. To begin, you create a log filter using the Logs Explorer in the Google Cloud console. This process uses an advanced filter to narrow log entries to specific events, such as a failed database snapshot or a security breach. Key elements of a filter include the Resource Type (specifies the service, like a compute disk or database instance), Log Name (identifies the specific log file to search), and Severity (filters for levels such as "ERROR" or "CRITICAL" to avoid unnecessary noise).
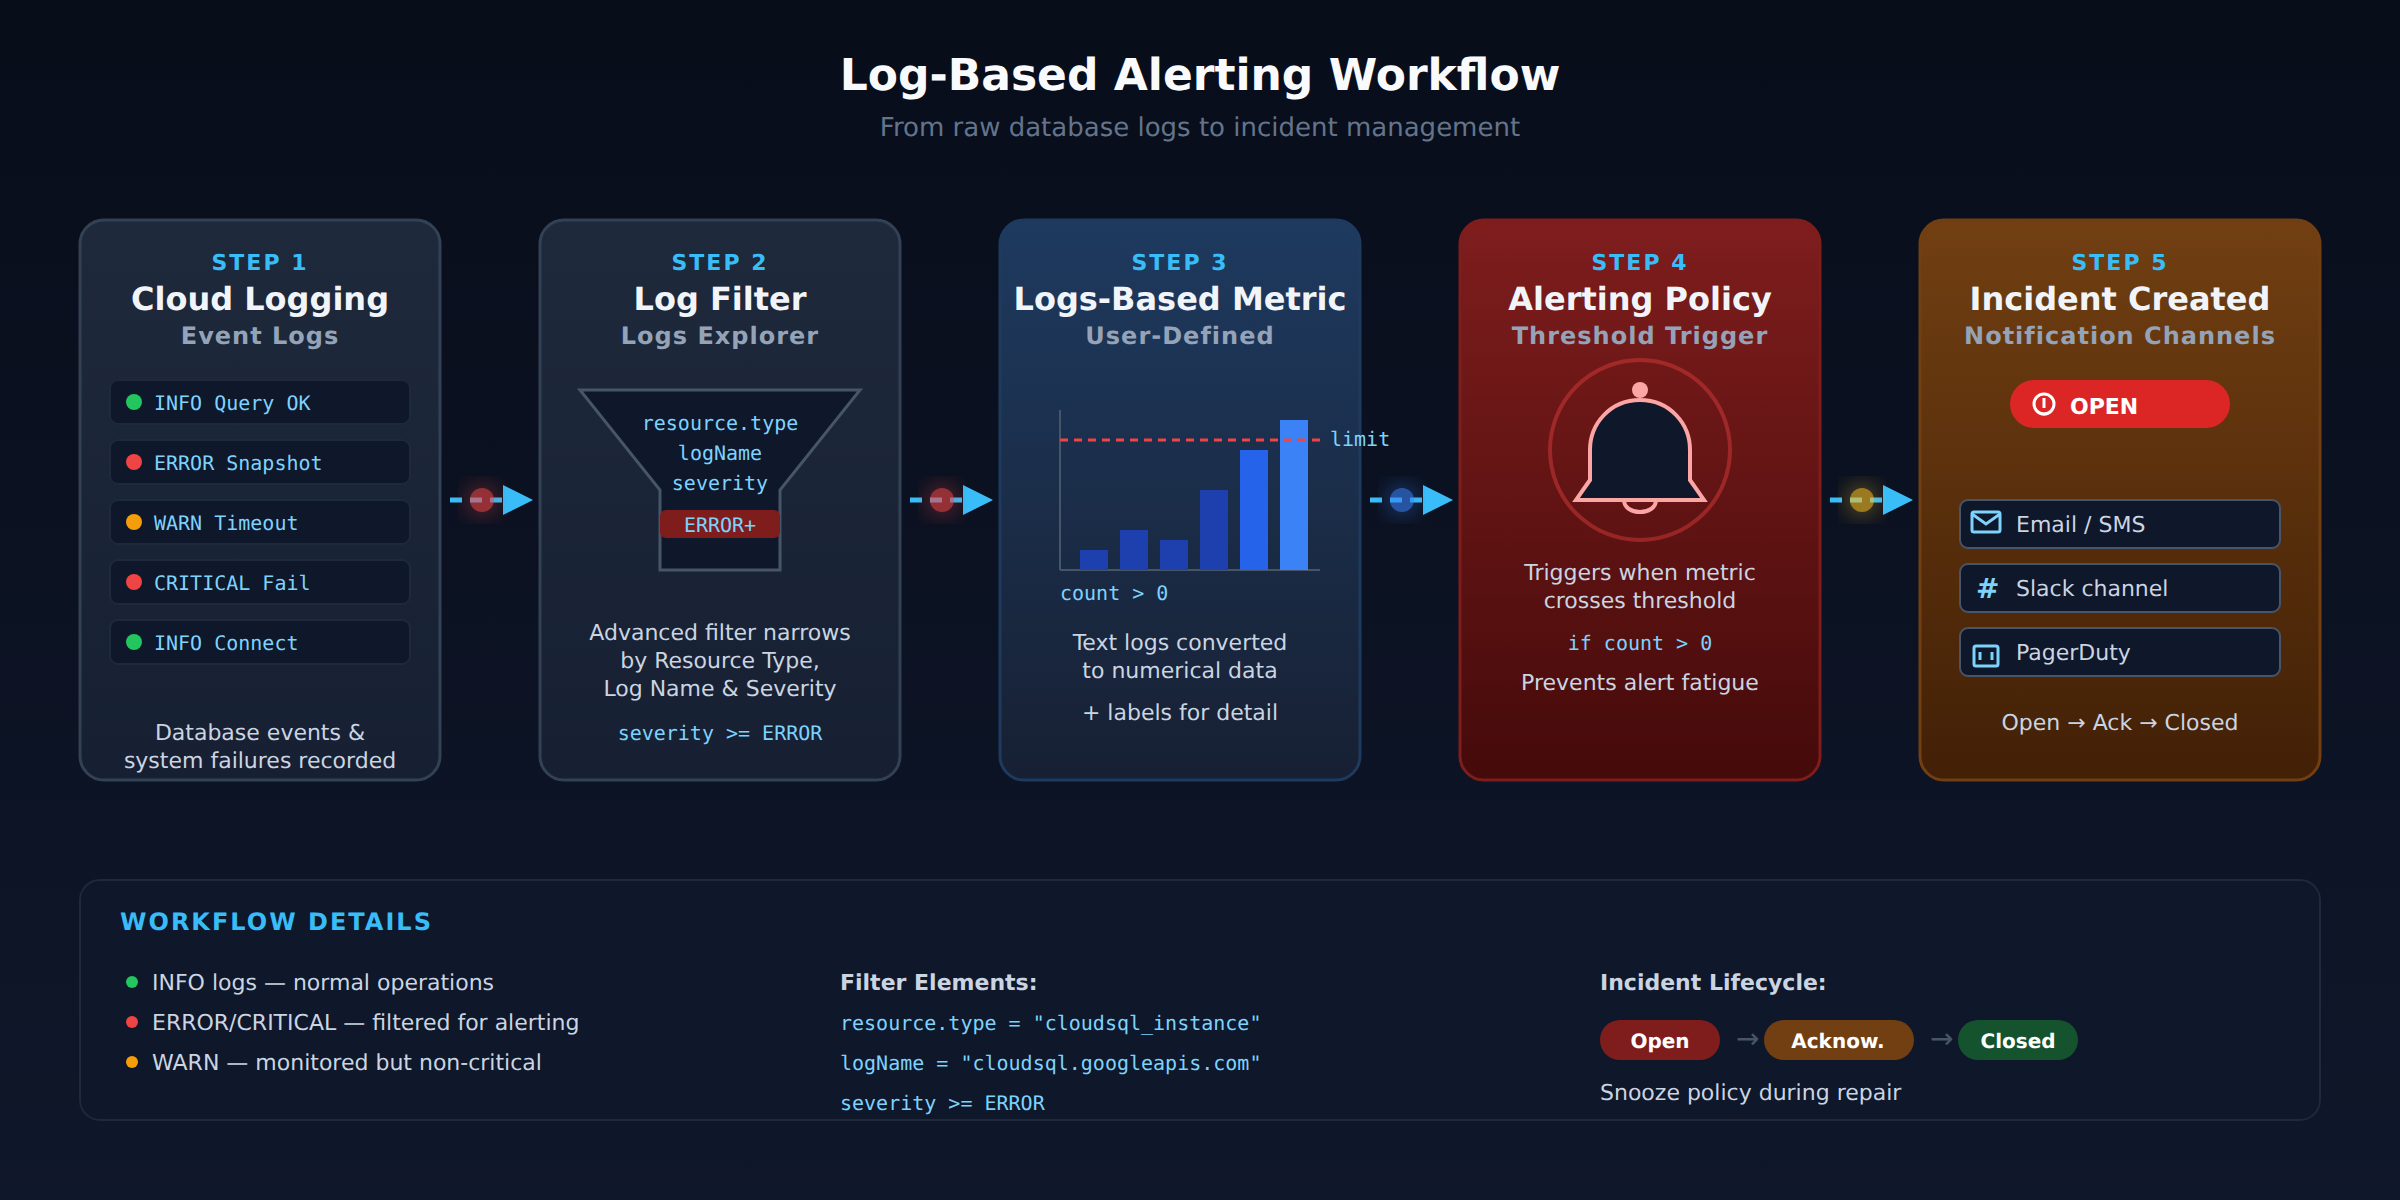
A five-step process flow showing how database logs are filtered by resource type and severity, converted into a logs-based metric, evaluated against a threshold in an alerting policy, and routed through notification channels to create an incident.
Once a filter is active, you can create a logs-based metric to count how often a specific event happens. This user-defined metric transforms text-based log data into numerical data that can be tracked over time. You can also add labels to capture more detail, such as the status of a failed request. Converting logs into metrics is the essential middle step between seeing an error and triggering an automated alert. The final step is to configure an alerting policy based on your new metric. You must define a threshold — the limit that triggers the alert, such as when a failure count goes above zero. Engineers should also set up notification channels to ensure the right people are informed via email, SMS, or Slack. Properly configured thresholds prevent "alert fatigue" by only notifying the team about truly critical issues. When an alert triggers, it creates an incident that must be managed through its lifecycle. Incidents move through states including Open, Acknowledged, and Closed. If an issue is already being fixed, you can snooze the policy to stop further notifications during the repair process. Closing an incident should happen only after the root cause is resolved and the system returns to a normal state.
Metric-based alerting policies are essential for maintaining system reliability and ensuring a proactive response to database issues. These policies rely on selecting critical performance metrics such as CPU utilization, disk IOPS, and memory usage. By establishing quantitative thresholds, administrators can receive notifications before resource exhaustion leads to a complete system failure. Monitoring memory usage is vital for preventing Out of Memory (OOM) events, which can crash a database instance. For instances with 16GB of RAM or less, a recommended alerting threshold is often set at 90%, while larger instances use 95%. Maintaining at least 10% of memory in the cache and free categories is a key strategy to ensure the database remains stable under load.
Effective monitoring frameworks also track Queries Per Second (QPS) and lock wait ratios to detect performance degradation. An anomaly is detected when these metrics surpass specific duration windows or baseline criteria established during normal operation. Key metrics to monitor include Total QPS (measures the overall volume of database requests to identify sudden spikes), Disk IOPS (tracks input/output operations to identify storage bottlenecks or hardware limitations), and Running Threads (monitors concurrent activity that might lead to resource contention and slowing response times). When an alert is triggered, tools like Query Insights and System Insights help engineers identify the root cause of the problem. These tools provide actionable recommendations, such as optimizing inefficient queries or adjusting database flags to improve performance. Implementing retry logic with exponential back-off further protects the application from transient errors during maintenance or high-load periods.
Optimistic concurrency controls assume conflicts are rare and do not use database locks; instead, the system checks if the document changed during the transaction and only writes if the data is untouched. Pessimistic concurrency controls assume conflicts are likely and use database locks to block other operations, returning an ABORTED error when a transaction fails due to high contention.
Query Insights helps find the source of performance problems by filtering data by database, user, or IP address, and showing the top contributors to database load. A high average execution time paired with low row counts usually points to missing indexes that need to be created.
Google Cloud has four main audit log types: Admin Activity logs record configuration changes and are always on; Data Access logs track when data is read or modified but must be turned on manually; System Event logs are generated by Google's systems; and Security logs track security-related events.
For instances with 16GB of RAM or less, a recommended alerting threshold is often set at 90% memory usage, while larger instances use 95%. Maintaining at least 10% of memory in the cache and free categories is a key strategy to ensure database stability under load.
 StudyCerts
 StudyCerts